
Monitoring NiFi 2 Clusters — Prometheus Exporter, 24 Alerts and Grafana Dashboards
An in-depth look at nifi-monitoring, an open-source monitoring stack for Cloudera CFM 4.12 (Apache NiFi 2.6): the REST API exporter design, recording rules, 24 alerts with 7 inhibition rules, six dashboards with click-through Provenance lookup, an alert relay and the verification suite.
NiFi has a friendly UI. Queues turn red on the canvas, Bulletins pop up next to processors, and the Summary page shows throughput. The catch is that all of this works only while someone is looking at the screen. When backpressure stops an upstream processor at 3 a.m., when a node drops out of the cluster, or when hundreds of ERROR Bulletins pile up for five minutes and then vanish, NiFi tells no one.
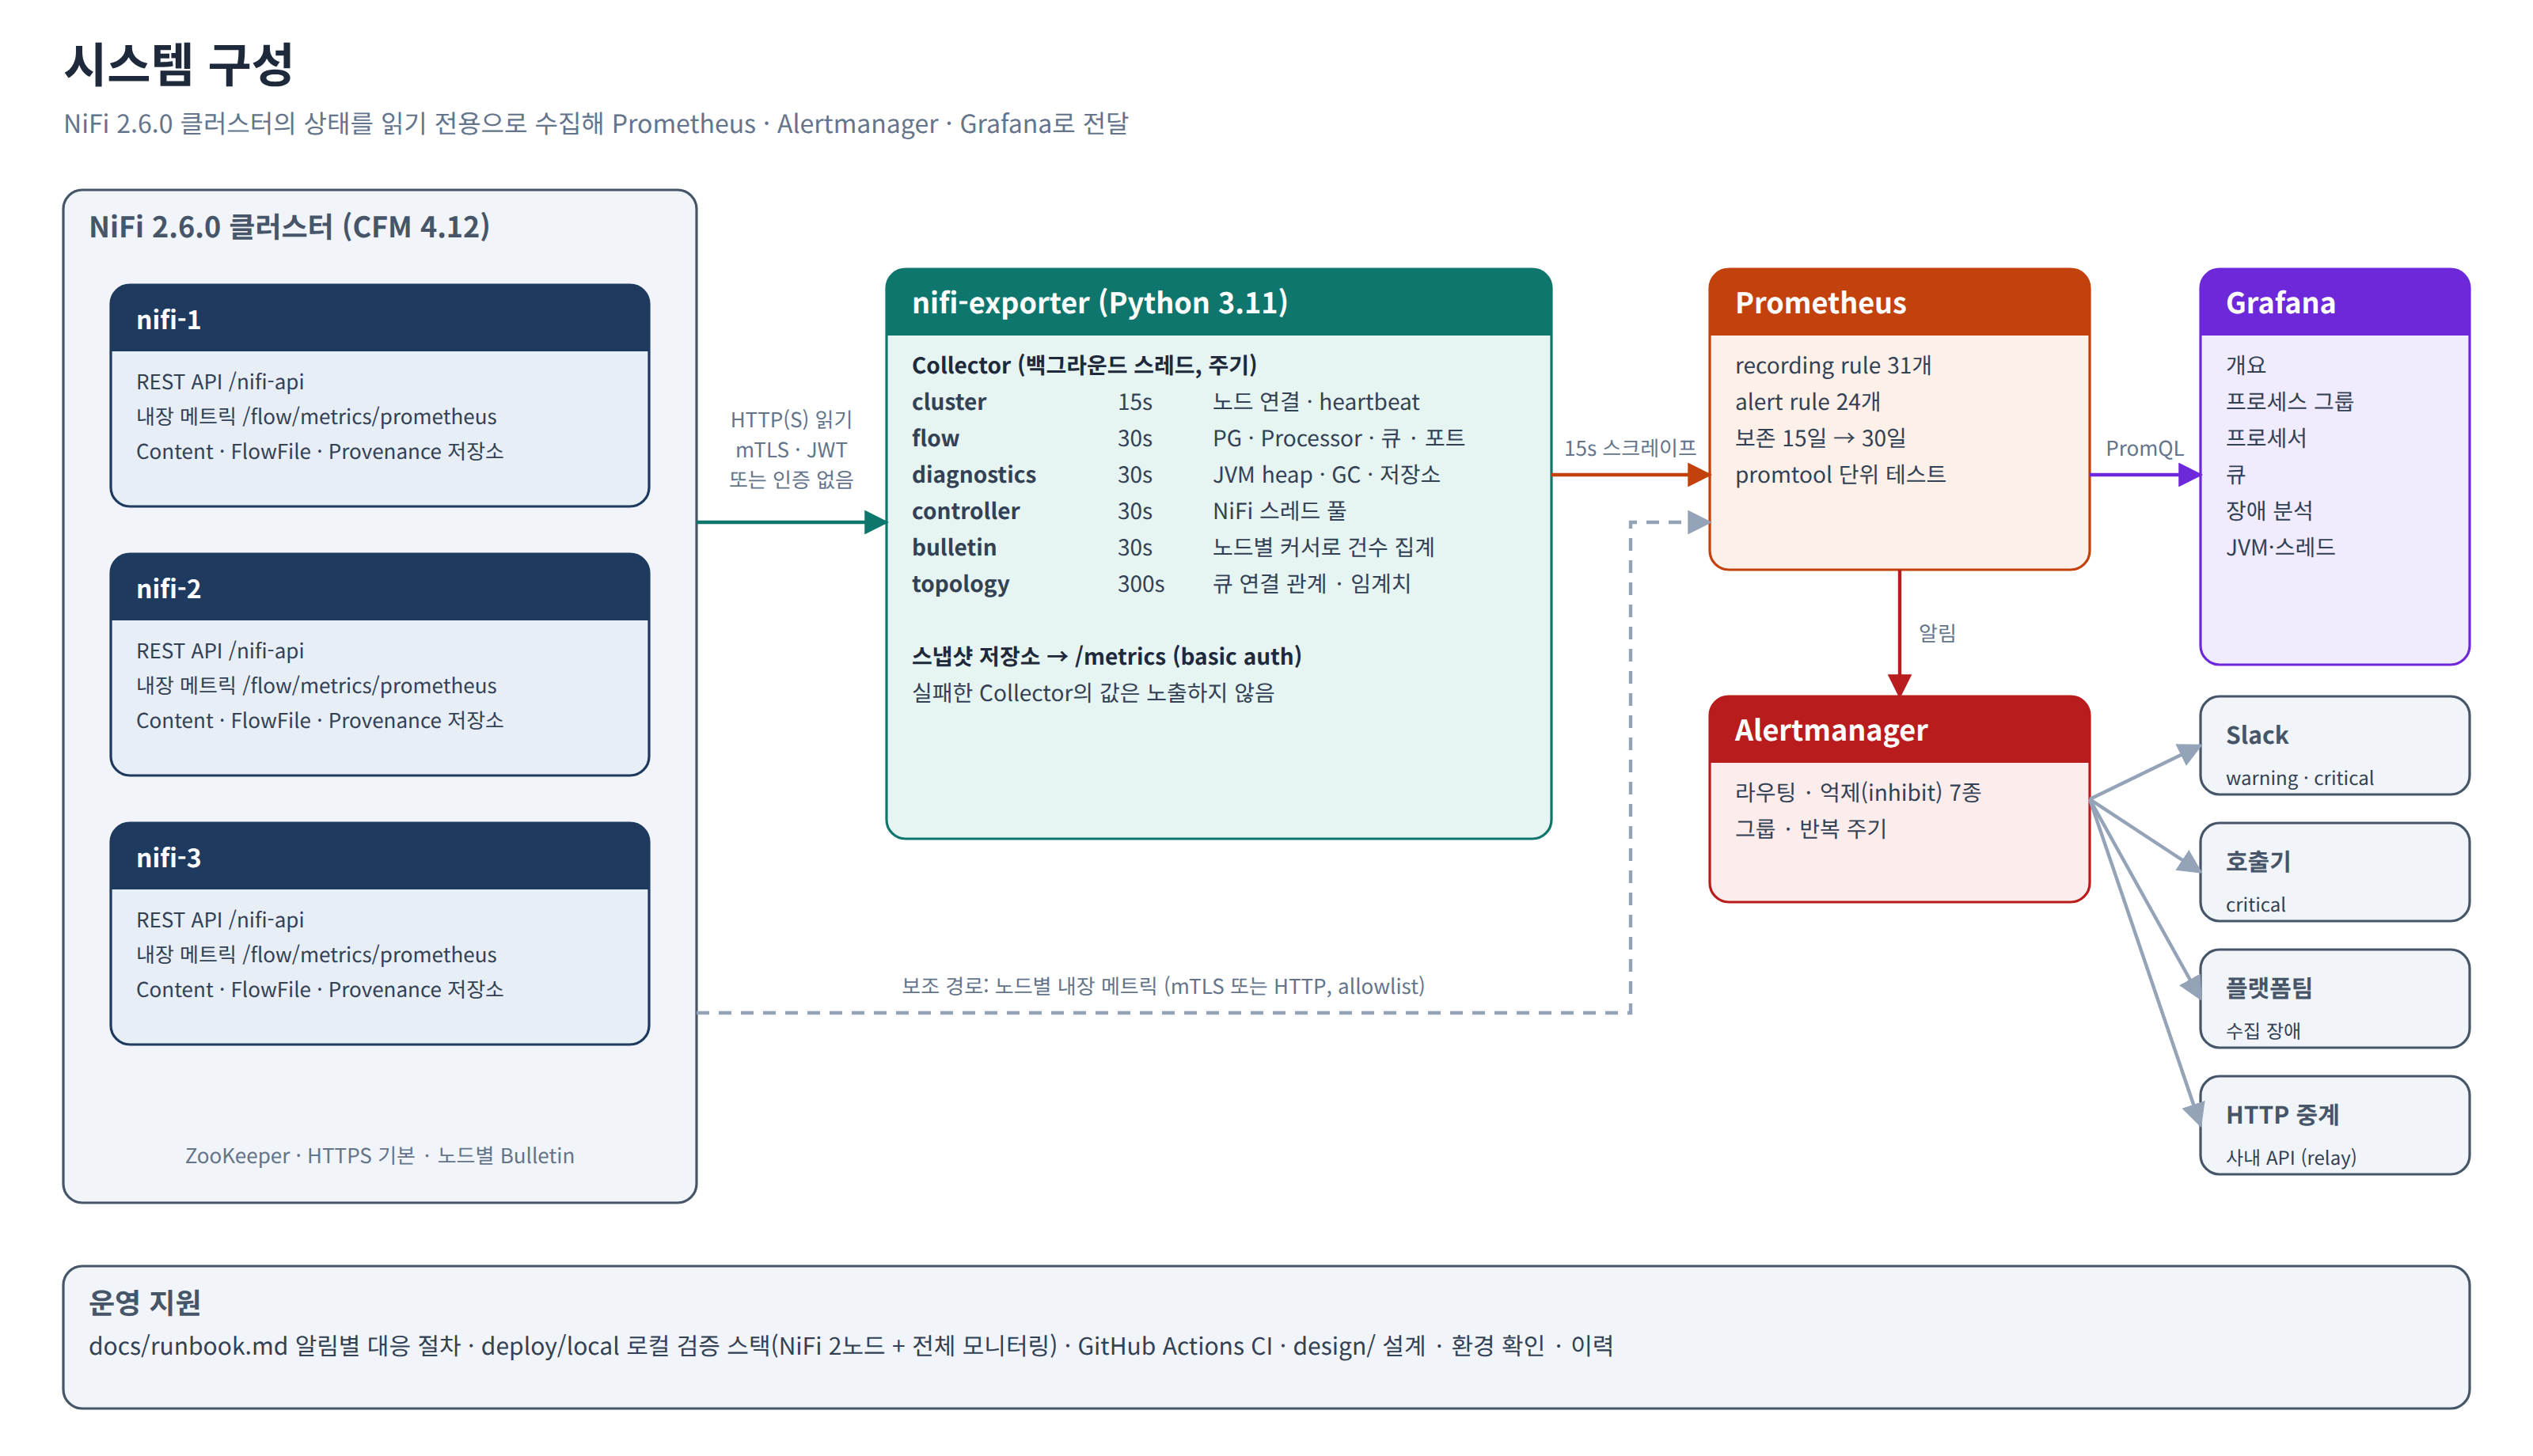
This post walks through nifi-monitoring, the monitoring stack we built to fill that gap. It targets Apache NiFi 2.6.0 as shipped in Cloudera Flow Management (CFM) 4.12, and was designed for the same on-premises, air-gapped customer environment described in our Oracle→Hive without Sqoop series. The repository is published under the Apache License 2.0.
The diagrams and screenshots below come from the repository and are labeled in Korean. The captions describe what each one shows.
At a glance
| Component | Role |
|---|---|
| nifi-exporter | Reads the NiFi REST API and exposes Prometheus metrics (Python 3.11) |
| nifi-provenance-query | Looks up Provenance for one processor and time range, from a Grafana link |
| nifi-alert-relay | Re-sends Alertmanager notifications in the format of in-house HTTP APIs |
| Prometheus rules | 31 recording rules, 24 alert rules, promtool unit tests |
| Alertmanager config | Routing, 7 inhibition rules, Slack templates |
| Grafana dashboards | 6 dashboards, generated by a script |
| Local verification stack | A 2-node NiFi 2.6.0 cluster plus everything above (Docker Compose) |
| Runbook | Meaning, where to look and what to do, per alert |
The three Python services are different entry points of the same package and Docker image. One image runs the exporter, the Provenance lookup and the alert relay.
1. Why a separate exporter
NiFi 2.x ships a Prometheus-format metrics endpoint on every node (/nifi-api/flow/metrics/prometheus). It looked sufficient at first, but it fell short once we tried to use it for real incident response.
- It is per node only. To see the cluster-wide queue backlog you must scrape every node and sum. When a node disconnects, its values simply disappear.
- There is no cluster state. Which node is DISCONNECTED or OFFLOADED, and how old its heartbeat is, lives only in
/controller/cluster. - There are no Bulletins. NiFi keeps Bulletins in memory — at most five per component, for about five minutes. If nobody counts them, nothing is recorded.
- There is no connection topology to decide "the downstream processor is running but the queue is stalled". That relationship exists only in the flow structure API.
So we built an exporter that reads the REST API and emits cluster-level metrics, and kept the built-in endpoint as an optional secondary path for when per-node breakdowns are needed (the nifi-builtin Prometheus job, with an allowlist that keeps only the metrics we use).
2. Designing nifi-exporter
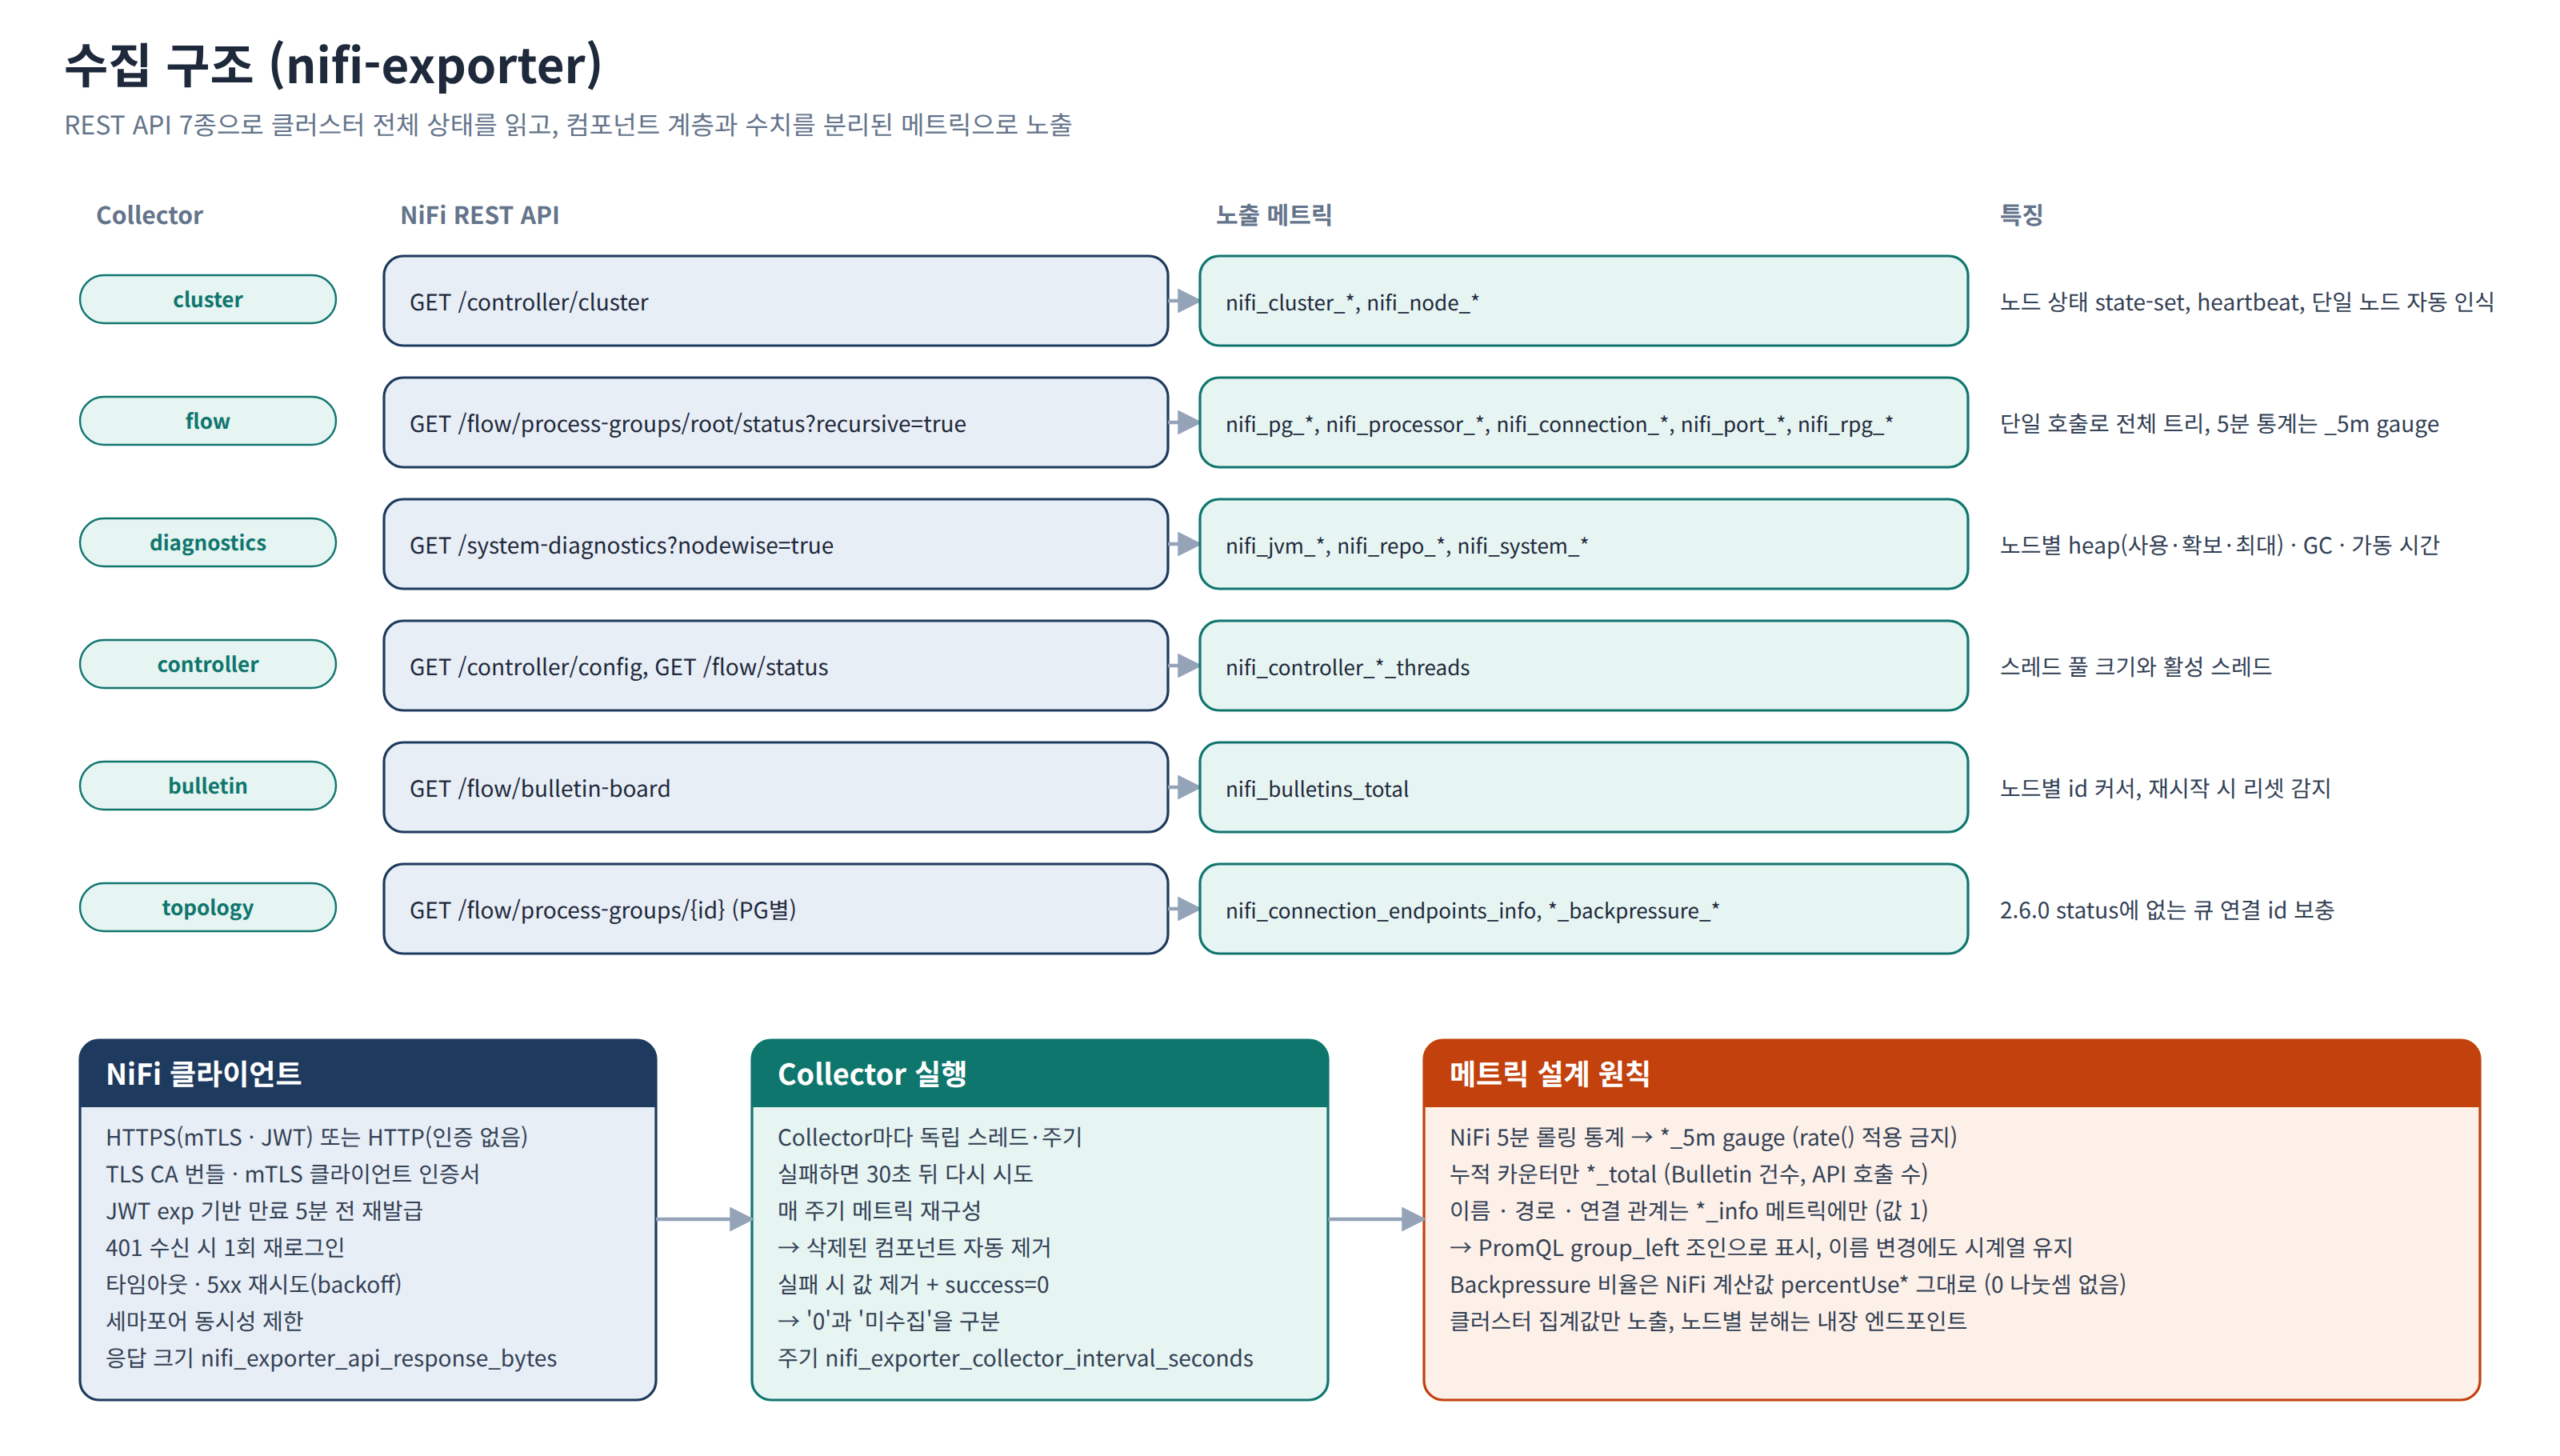
2.1 Six collectors
| Collector | NiFi API | Interval | Key metrics (prefix nifi_) |
|---|---|---|---|
cluster | GET /controller/cluster (on 404, /flow/cluster/summary) | 15s | cluster_nodes_total, cluster_nodes_connected, node_status, node_heartbeat_age_seconds, node_active_threads, node_queued_* |
flow | GET /flow/process-groups/root/status?recursive=true | 30s | pg_*, processor_*, connection_*, port_*, rpg_* |
diagnostics | GET /system-diagnostics?nodewise=true | 30s | jvm_heap_*, jvm_gc_*_total, jvm_threads, repo_*, system_* |
controller | GET /controller/config, GET /flow/status | 30s | controller_max_timer_driven_threads, controller_active_threads, controller_terminated_threads |
bulletin | GET /flow/bulletin-board | 30s | bulletins_total, bulletins_observed_5m, bulletin_last_timestamp_seconds |
topology | GET /flow/process-groups/{id} (per group) | 300s | connection_endpoints_info, connection_backpressure_*_threshold |
The flow collector fetches the status of the entire Process Group tree in a single recursive=true call. As flows grow, this becomes the heaviest response, so the exporter reports its own response sizes in nifi_exporter_api_response_bytes and warns when it stays above 10 MB for 30 minutes (NiFiExporterFlowResponseLarge). The fix is to raise the interval to 60 seconds or drop some groups with exclude_pg_ids.
2.2 Decoupling scrapes from collection
The most important design decision is that a /metrics request never calls NiFi. Each collector has its own background thread and interval and writes its result to a snapshot store; /metrics only serializes that snapshot.
def run_once(self) -> bool:
    name = self.collector.name
    started = time.monotonic()
    try:
        families = self.collector.collect()
    except Exception as e:
        self._store.clear(name)                        # drop the values on failure
        self._sm.collector_success.labels(name).set(0)
        ...
        return False
    self._store.set(name, families)
    self._sm.collector_success.labels(name).set(1)
    ...
This solves several problems at once.
- Prometheus scrapes are never held hostage by a slow NiFi response, so
updoes not flip to 0 because of scrape timeouts. - Each collector gets its own interval: 15 seconds for node state, 5 minutes for the heavy topology walk.
- Adding more Prometheus servers does not add NiFi calls.
2.3 Telling "0" apart from "not collected"
When a collector fails, the exporter neither keeps the old values nor reports zeros. It removes that collector's metrics from the output entirely and sets nifi_exporter_collector_success{collector} to 0.
Keeping old values makes the dashboard look healthy while NiFi is down; reporting zeros produces false "all clear" signals such as "queue backlog 0". Only missing values let dashboards and alerts honestly say "we don't know". That gap is in turn covered by alerts on collection itself (NiFiCollectorFailing, NiFiCollectorStale) and by the collector status panel at the top of every dashboard.
A failed collector is retried after 30 seconds even when its interval is longer. If the 300-second topology collector failed once right after a NiFi restart and then waited five minutes, NiFiCollectorFailing would suppress every other alert for that cluster in the meantime.
2.4 Metric conventions: _5m, _total, _info
| Convention | Meaning |
|---|---|
*_5m | NiFi's own 5-minute rolling statistics, exported as gauges. Never apply rate()/increase(). |
*_total | Only counters the exporter accumulates itself (Bulletin counts, API calls). |
*_info | Names, paths, types and connections live only in info metrics with value 1. |
Numeric metrics carry only ids; human-readable names are joined in.
nifi_pg_queued_flowfiles
  * on (cluster, pg_id) group_left (pg_path) nifi_pg_info
It looks verbose, but there is a reason. If a name were a label on numeric series, renaming a processor or moving a group would end the series and start a new one, resetting trend graphs and every for clause. With names split into info metrics, numeric series continue across renames. Backpressure ratios are exported straight from NiFi's percentUseCount and percentUseBytes, so there is no divide-by-zero on a zero threshold.
2.5 The topology collector fills a NiFi 2.6 gap
NiFi 2.x status responses (/flow/process-groups/root/status) include a connection's source and destination names but not their ids. Names can collide, so you cannot reliably answer "is this queue's downstream processor running?".
The topology collector therefore reads the flow structure API for each Process Group every five minutes and adds nifi_connection_endpoints_info (source and destination ids and types) and the backpressure thresholds. Prometheus joins this with processor run status to produce, per queue, "1 if the downstream processor is running".
# nifi:connection_destination_running
nifi_connection_endpoints_info{destination_type="PROCESSOR"}
  * on (cluster, destination_id) group_left ()
  label_replace(nifi_processor_running, "destination_id", "$1", "processor_id", "(.*)")
This series is what makes the "downstream is running but consumes nothing" alert (NiFiQueueStalled) work.
2.6 Counting each Bulletin exactly once
Bulletins were the hardest thing to collect. On a NiFi 2.6.0 cluster we confirmed the following:
- Bulletin ids are a separate sequence per node, and the
after/limitparameters also apply per node. - When a node restarts, its sequence starts again from 0.
- Retention is at most five per component, for about five minutes.
The exporter therefore keeps a cursor per node (the last id seen). Every cycle it fetches the whole board and counts only ids above the cursor; if a node's newest id drops below its cursor, the node restarted and its cursor is reset. If a node returned exactly limit entries it may have more, so the exporter pages on with after=<newest id>.
The first cycle only sets cursors and counts nothing, so restarting the exporter never recounts old Bulletins. The side effect is that a cumulative counter's first sample has no preceding zero, so Prometheus increase() misses the first batch from a new source. We solved this by having the exporter also publish the number of new Bulletins observed in the last five minutes as a gauge (nifi_bulletins_observed_5m), which the alerts use.
Message text is never used as a label, to avoid a cardinality explosion. If you need the text, server.log_bulletin_messages: true writes it to the exporter's JSON log for your log pipeline. Because of NiFi's retention limit, Bulletin counts are always a lower bound.
2.7 Authentication, standalone nodes and self-monitoring
- Authentication:
bearer(Single User, LDAP or Kerberos viaPOST /access/token; the JWT is renewed 5 minutes before itsexp, with one re-login on 401),mtls(client certificate), ornone(plain HTTP NiFi without TLS or auth).http://URLs accept onlynone. - Permissions: on 2.6.0 we confirmed that four view policies are enough for every collector —
/flow,/controller,/system, and view the component on the root Process Group — for a read-only account. - Standalone NiFi: a non-clustered NiFi returns 404 for
/controller/cluster. The exporter then checks/flow/cluster/summary, and if it is a standalone node it reportsnifi_cluster_clustered0 instead of a failure. A 404 from a clustered NiFi means the node the exporter talks to has disconnected, which is reported as a failure. - Protection and probes:
/metricscan be protected with basic auth;/healthz(process alive) and/readyz(some collector has succeeded at least once) stay open. - Self-monitoring: per-collector success, duration, interval and last-success time; per-endpoint API call counts and response sizes; token expiry time.
- The image runs as non-root (uid 65534).
3. Prometheus: recording rules and sizing
The 31 recording rules do four kinds of work.
| Group | Example |
|---|---|
| Deltas | nifi:connection_queued_flowfiles:delta10m — 5- and 10-minute growth of queue backlog |
| Naming | nifi:connection_percent_used:named — the larger of the count and byte backpressure ratios, joined with queue, source and destination names |
| Derived signals | nifi:processor_task_duration_avg_seconds_5m, nifi:jvm_gc_time_ratio:rate5m, nifi:thread_pool_utilization |
| Overview aggregates | nifi:queues_near_backpressure:count, nifi:processors_invalid:count, cluster sums of built-in per-node values |
Thread pool utilization proved especially useful in practice. It divides each node's active threads by maxTimerDrivenThreadCount, so it shows directly when processing backs up because processors are waiting for threads. On standalone NiFi it is computed from the total active threads and labeled node_id="standalone".
Sizing uses per-component series counts measured on 2.6.0 (17 per processor, 12 per connection, 15 per Process Group, 39 per node).
| Example: 2,000 processors · 3,000 connections · 300 PGs · 3 nodes | Value |
|---|---|
| Series | ~107k (exporter 75k + recording rules 32k); +175k with the built-in endpoint |
| Disk | ~19 GB for 15 days, ~38 GB for 30 days |
| NiFi calls | ~7 per 30 seconds, plus one per Process Group every 5 minutes |
Enabling the built-in endpoint more than doubles the series count, so we recommend turning it on only when per-node breakdowns are truly needed.
4. 24 alerts and 7 inhibition rules
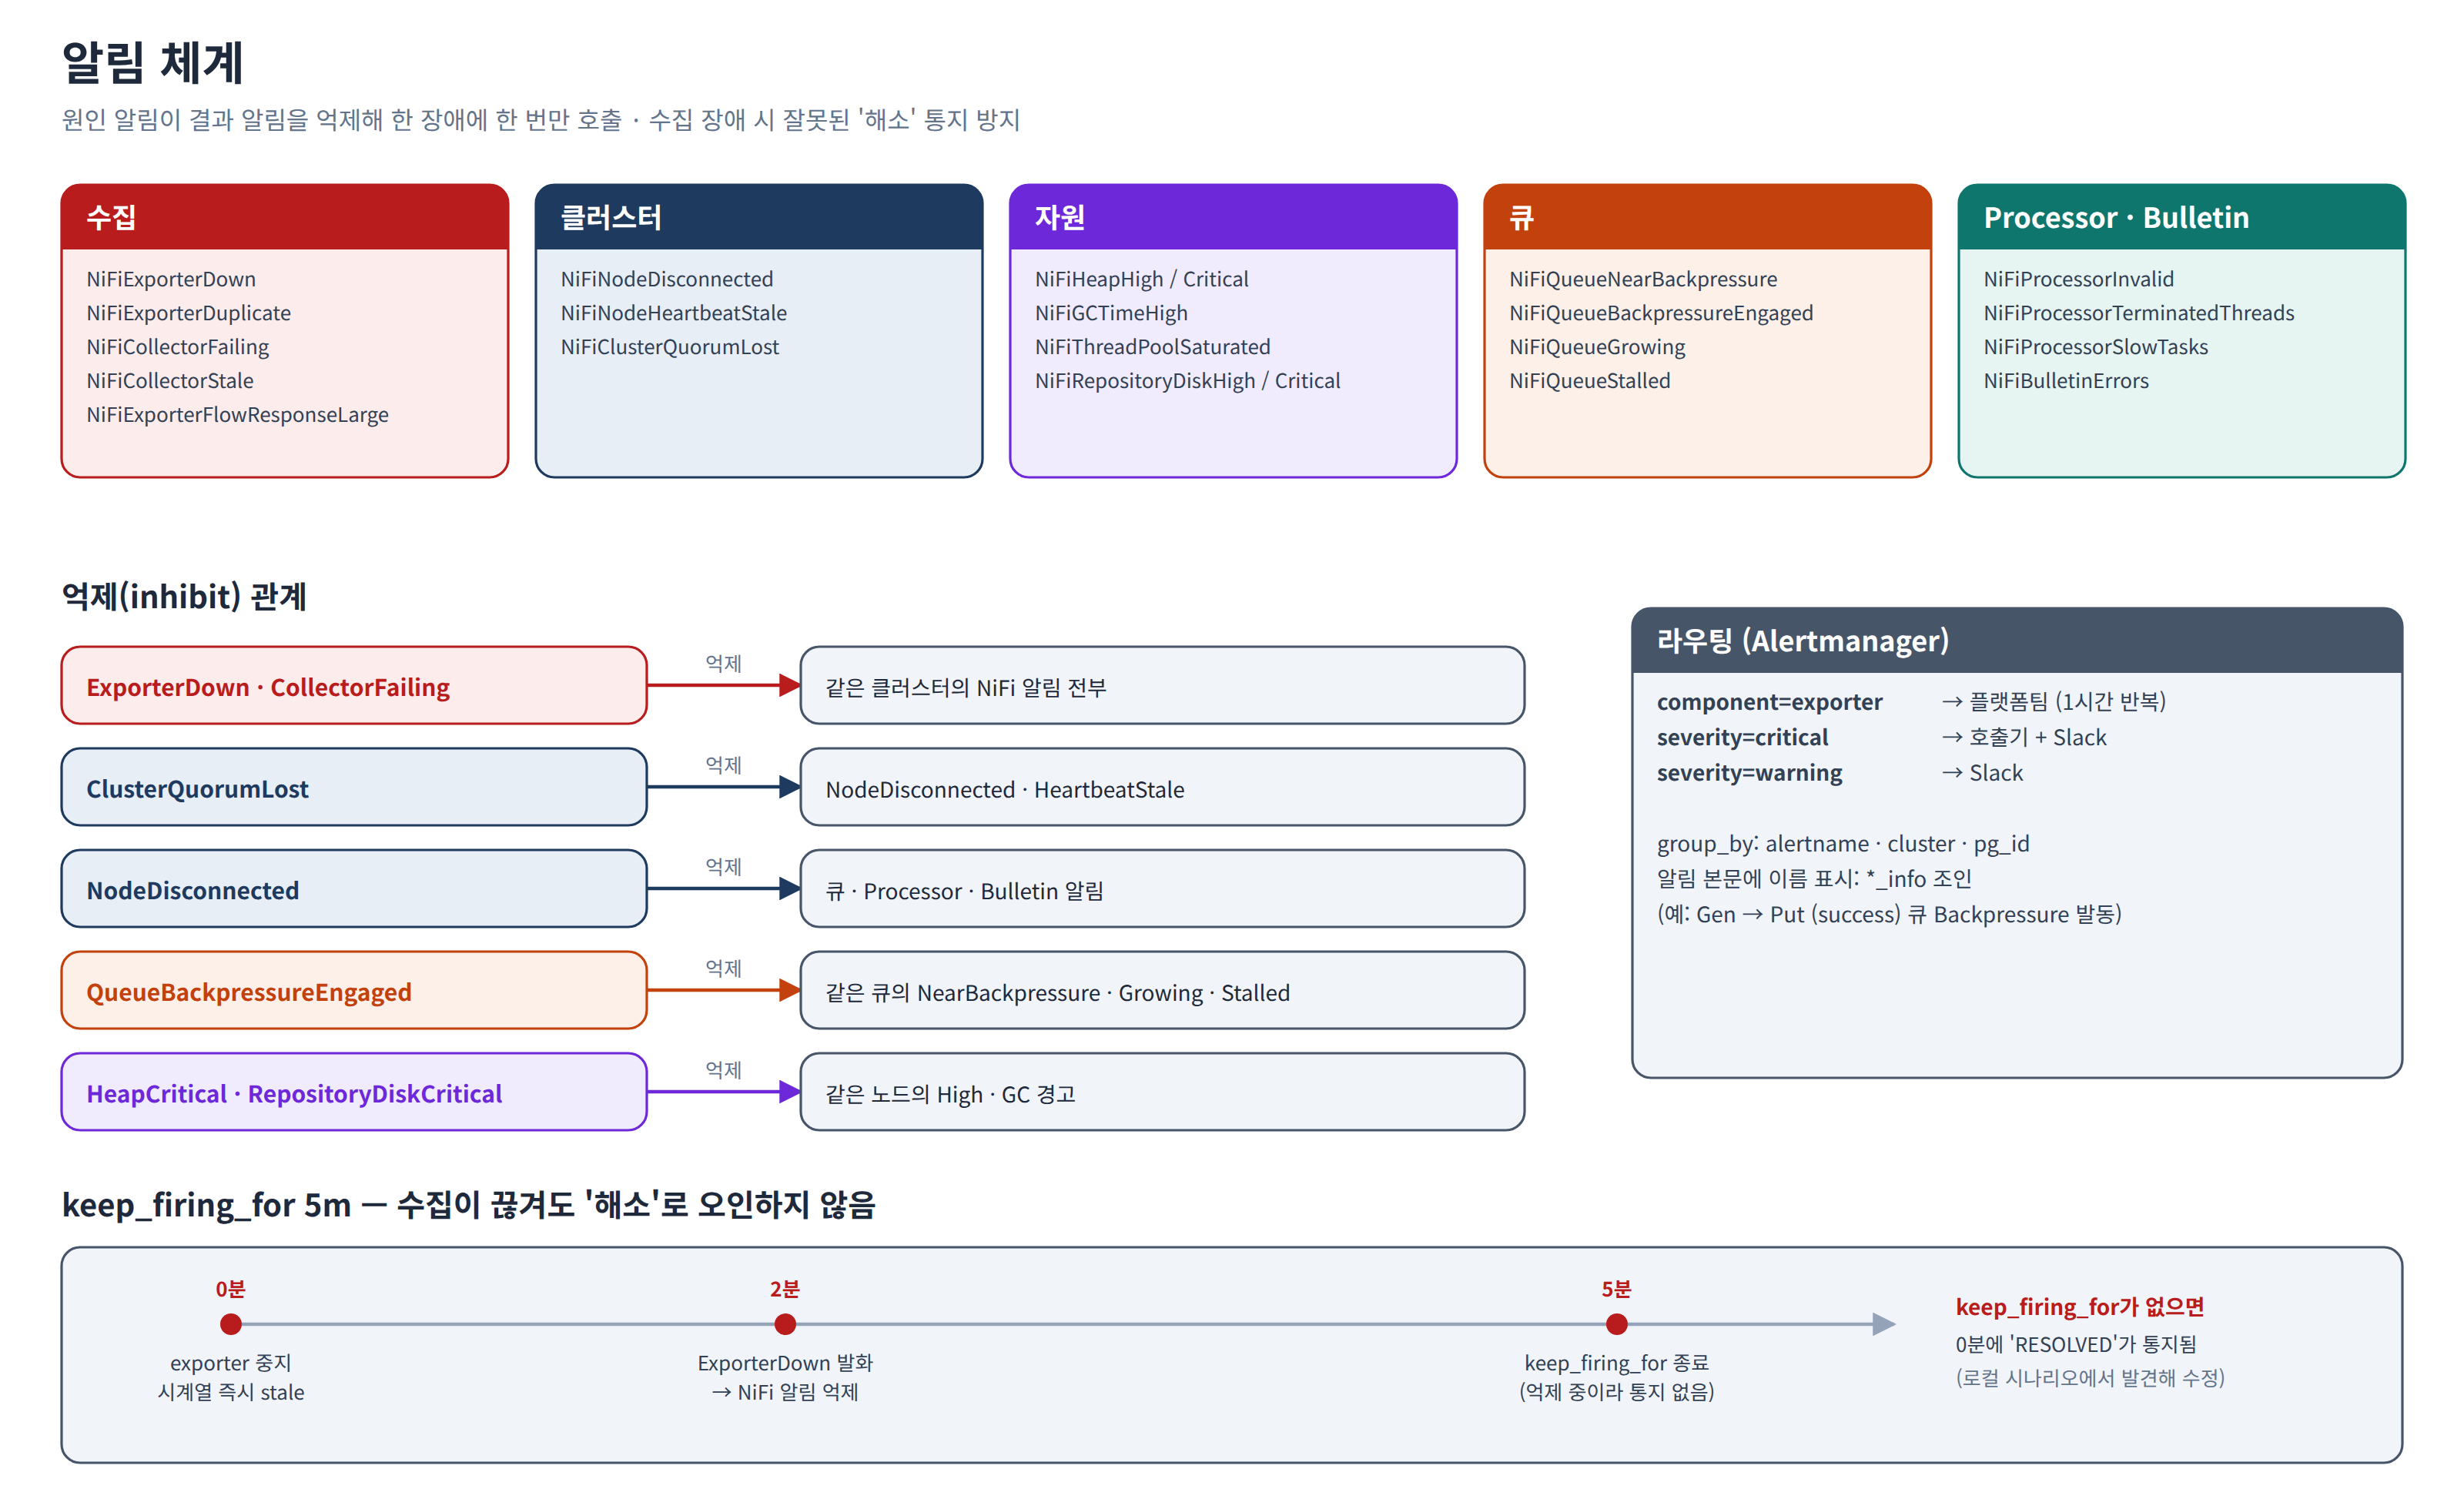
4.1 The alerts
| Area | Alert | Severity | Condition (initial) |
|---|---|---|---|
| Collection | NiFiExporterDown | critical | Scrape failing for 2m |
NiFiExporterDuplicate | critical | 2+ exporters for one cluster | |
NiFiCollectorFailing | critical | Collector failing for 3m | |
NiFiCollectorStale | warning | 3× the interval (min 3m) since last success | |
NiFiExporterFlowResponseLarge | warning | Flow response > 10 MB for 30m | |
| Cluster | NiFiNodeDisconnected | critical | Node not CONNECTED for 2m |
NiFiNodeHeartbeatStale | warning | Heartbeat older than 60s | |
NiFiClusterQuorumLost | critical | Connected nodes below majority | |
| Resources | NiFiHeapHigh / NiFiHeapCritical | warning / critical | Heap 85% for 10m / 95% for 3m |
NiFiGCTimeHigh | warning | GC time ratio 20% for 10m | |
NiFiThreadPoolSaturated | warning | Thread pool ≥ 90% for 10m | |
NiFiRepositoryDiskHigh / Critical | warning / critical | Repository 80% for 10m / 92% for 2m | |
| Queues | NiFiQueueNearBackpressure | warning | Backpressure > 80% for 5m |
NiFiQueueBackpressureEngaged | critical | Backpressure 100% for 5m | |
NiFiQueueGrowing | warning | +1,000 FlowFiles in 10m | |
NiFiQueueStalled | warning | Downstream running but zero consumption for 10m | |
| Processors | NiFiProcessorInvalid | warning | Invalid for 5m |
NiFiProcessorTerminatedThreads | warning | Terminated threads for 5m | |
NiFiProcessorSlowTasks | warning | Average task > 30s for 10m | |
| Bulletins | NiFiBulletinErrors | warning | > 10 ERRORs from one source in 5m |
| Relay | NiFiAlertRelayDown / Failing | warning | Relay down for 5m / delivery failures in last 15m |
The stalled-queue alert reuses the join built earlier.
- alert: NiFiQueueStalled
  expr: |
    (
      nifi_connection_queued_flowfiles > 0
      and nifi_connection_flowfiles_out_5m == 0
      and on (cluster, connection_id) nifi:connection_destination_running == 1
    )
    * on (cluster, connection_id) group_left (name, source_name, destination_name)
    nifi_connection_info
  for: 10m
  keep_firing_for: 5m
Notifications include source_name → destination_name (queue name), so the on-call engineer does not have to hunt through NiFi with an id in hand.
4.2 Causes suppress effects
When one failure fans out into dozens of alerts, the alert that names the cause gets buried. Seven Alertmanager inhibition rules suppress effect alerts while the cause alert is firing.
| Firing alert | Suppressed alerts |
|---|---|
NiFiExporterDown, NiFiCollectorFailing | Every non-exporter alert for the same cluster |
NiFiNodeDisconnected | Queue, processor and Bulletin alerts for the same cluster |
NiFiClusterQuorumLost | NiFiNodeDisconnected, NiFiNodeHeartbeatStale |
NiFiQueueBackpressureEngaged | NearBackpressure, Growing, Stalled for the same queue |
NiFiHeapCritical | NiFiHeapHigh, NiFiGCTimeHigh for the same node |
NiFiRepositoryDiskCritical | NiFiRepositoryDiskHigh for the same repository |
NiFiCollectorFailing | NiFiCollectorStale for the same collector |
The first rule is the key one. When collection stops, NiFi's state is unknown, not healthy — so nobody gets paged on missing or partial data.
4.3 keep_firing_for prevents false "resolved"
When collection drops briefly, the input series of an alert expression disappear, Prometheus treats that as "condition cleared" and sends RESOLVED — followed by a fresh FIRING as soon as collection returns. For on-call engineers that is the worst kind of noise.
Every NiFi state alert carries keep_firing_for: 5m, so it stays firing for five minutes after the condition clears. The price is that real resolutions arrive up to five minutes late, which we judged better than false ones. This feature is why Prometheus 2.42 or later is required.
4.4 Routing
| Order | Receiver | Condition |
|---|---|---|
| 1 | custom-relay (alert relay) | All alerts; per-target filtering happens in the relay (continue: true) |
| 2 | Platform team email | component="exporter" (collection failures) |
| 3 | Pager + Slack | severity="critical" |
| 4 | Slack | severity="warning" |
Collection failures belong to the platform team that runs the monitoring, not to NiFi operators, so they are routed separately. All thresholds are initial values; the runbook asks teams to tune them after two weeks of production data and record the changes in its threshold log.
5. Six Grafana dashboards
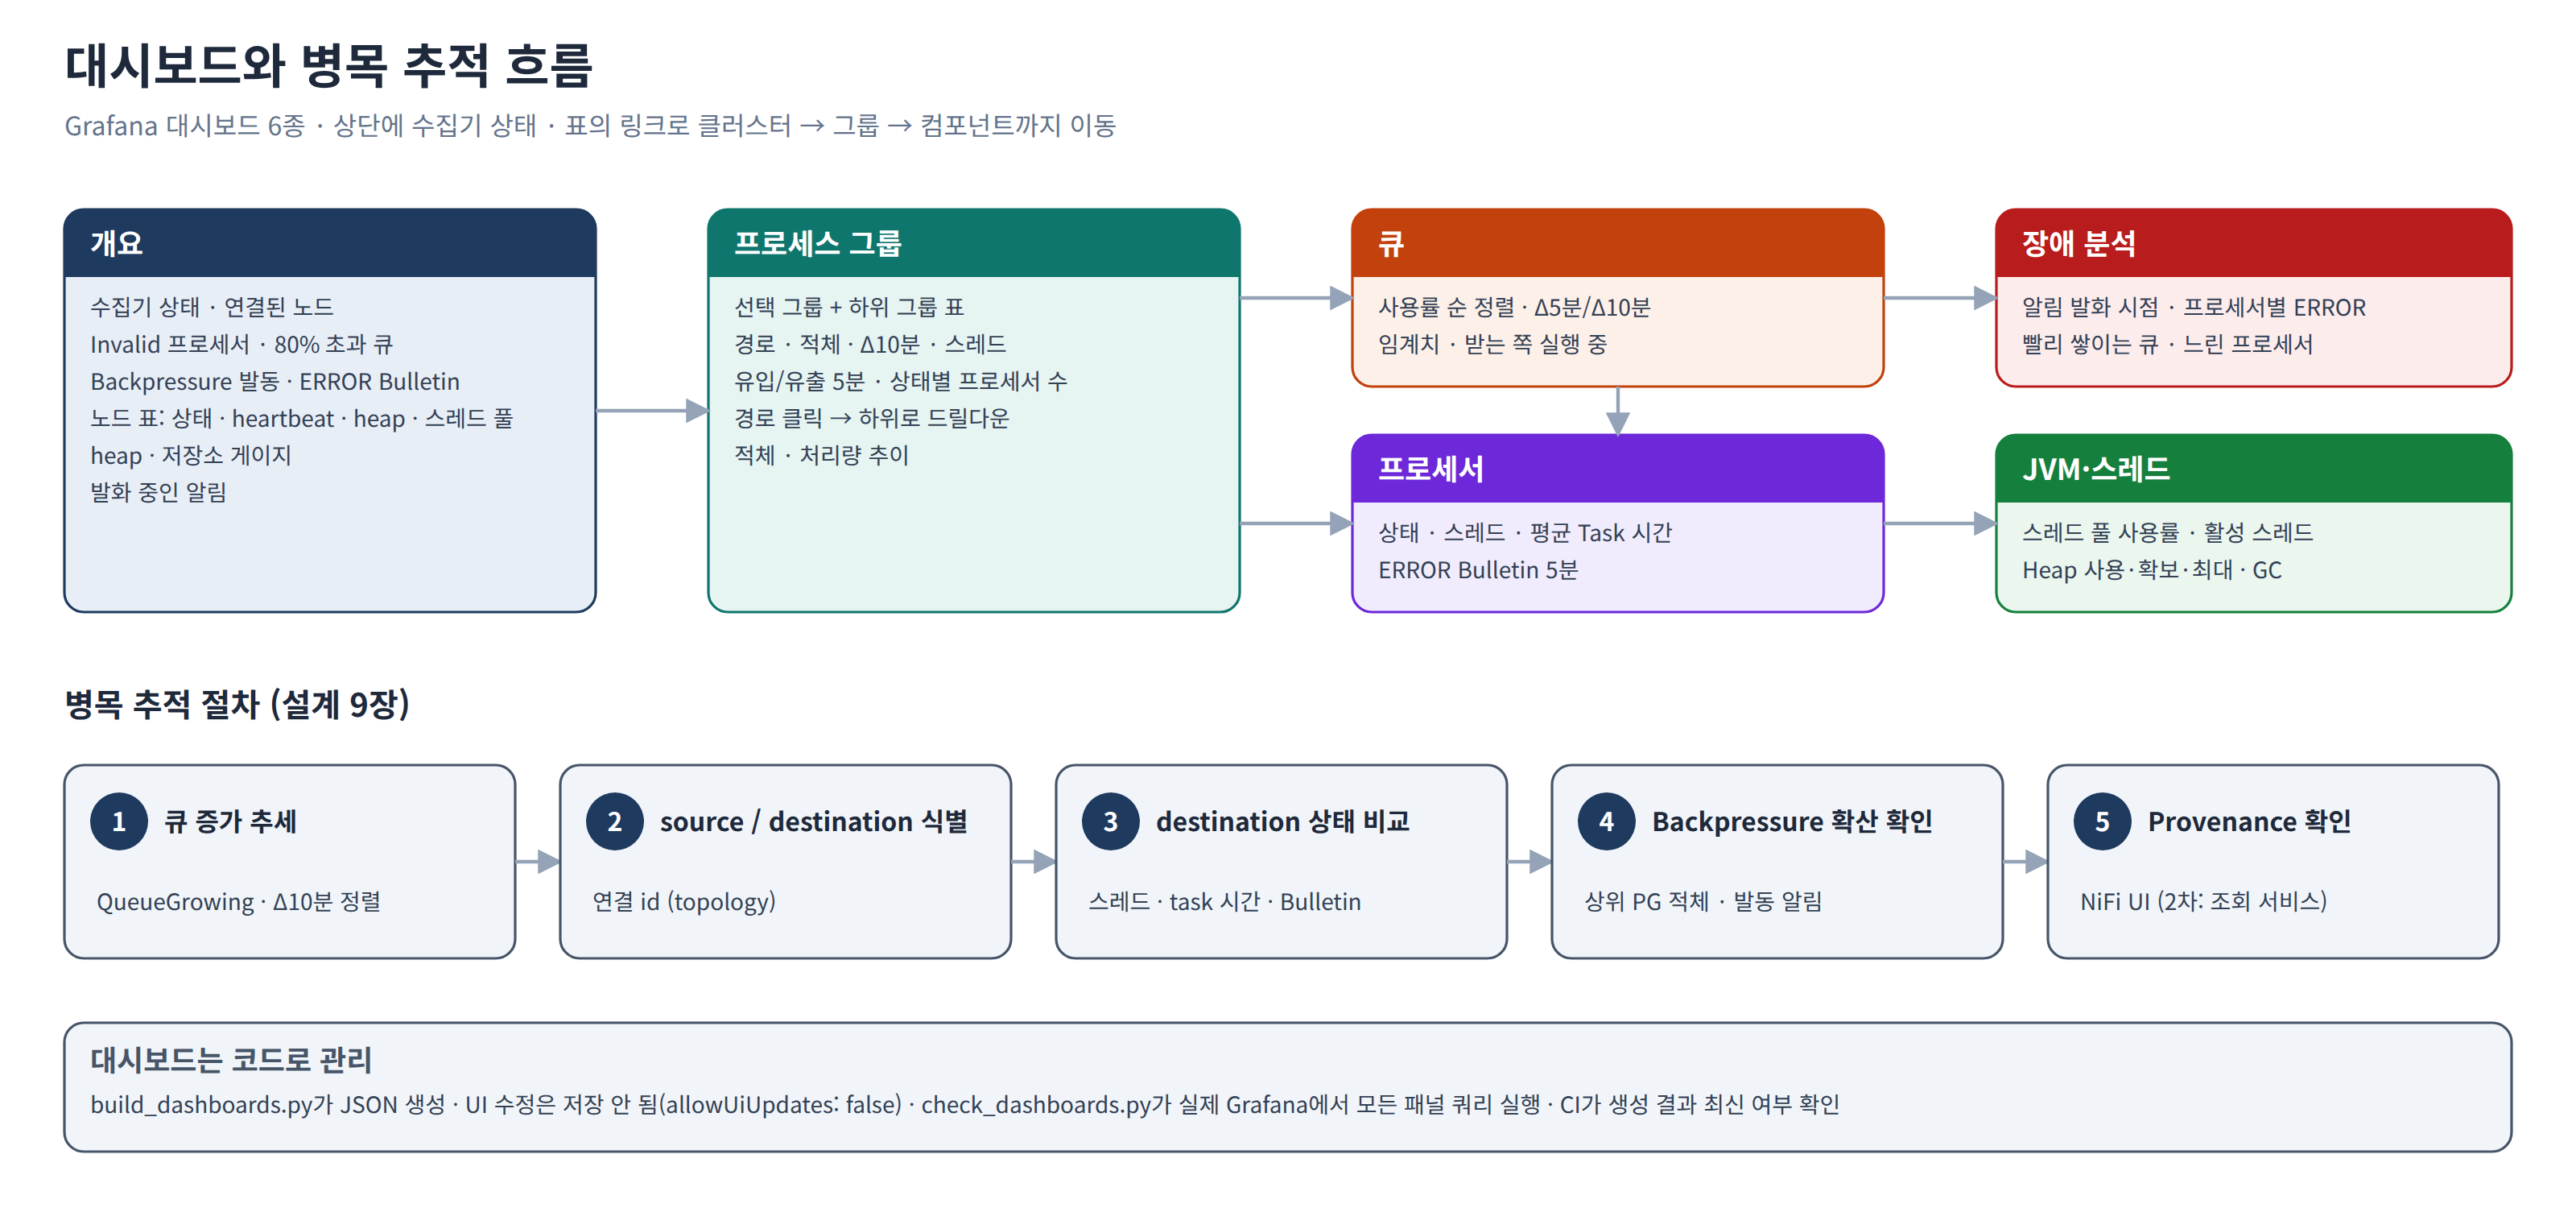
| Dashboard | Contents |
|---|---|
| Overview | Collection status, connected nodes, invalid processors, queues above 80%, engaged backpressure, ERROR Bulletins, node table (state, heartbeat, threads, backlog, heap, repositories, thread pool, uptime), firing alerts |
| Process Groups | Selected group and its children (path, backlog, Δ10m, threads, I/O, processors by state). Click a path to drill down |
| Processors | State, threads, average task time, I/O and ERROR Bulletins per processor, with trends |
| Queues | Queues sorted by backpressure usage (Δ5m, Δ10m, thresholds, downstream running), with trends |
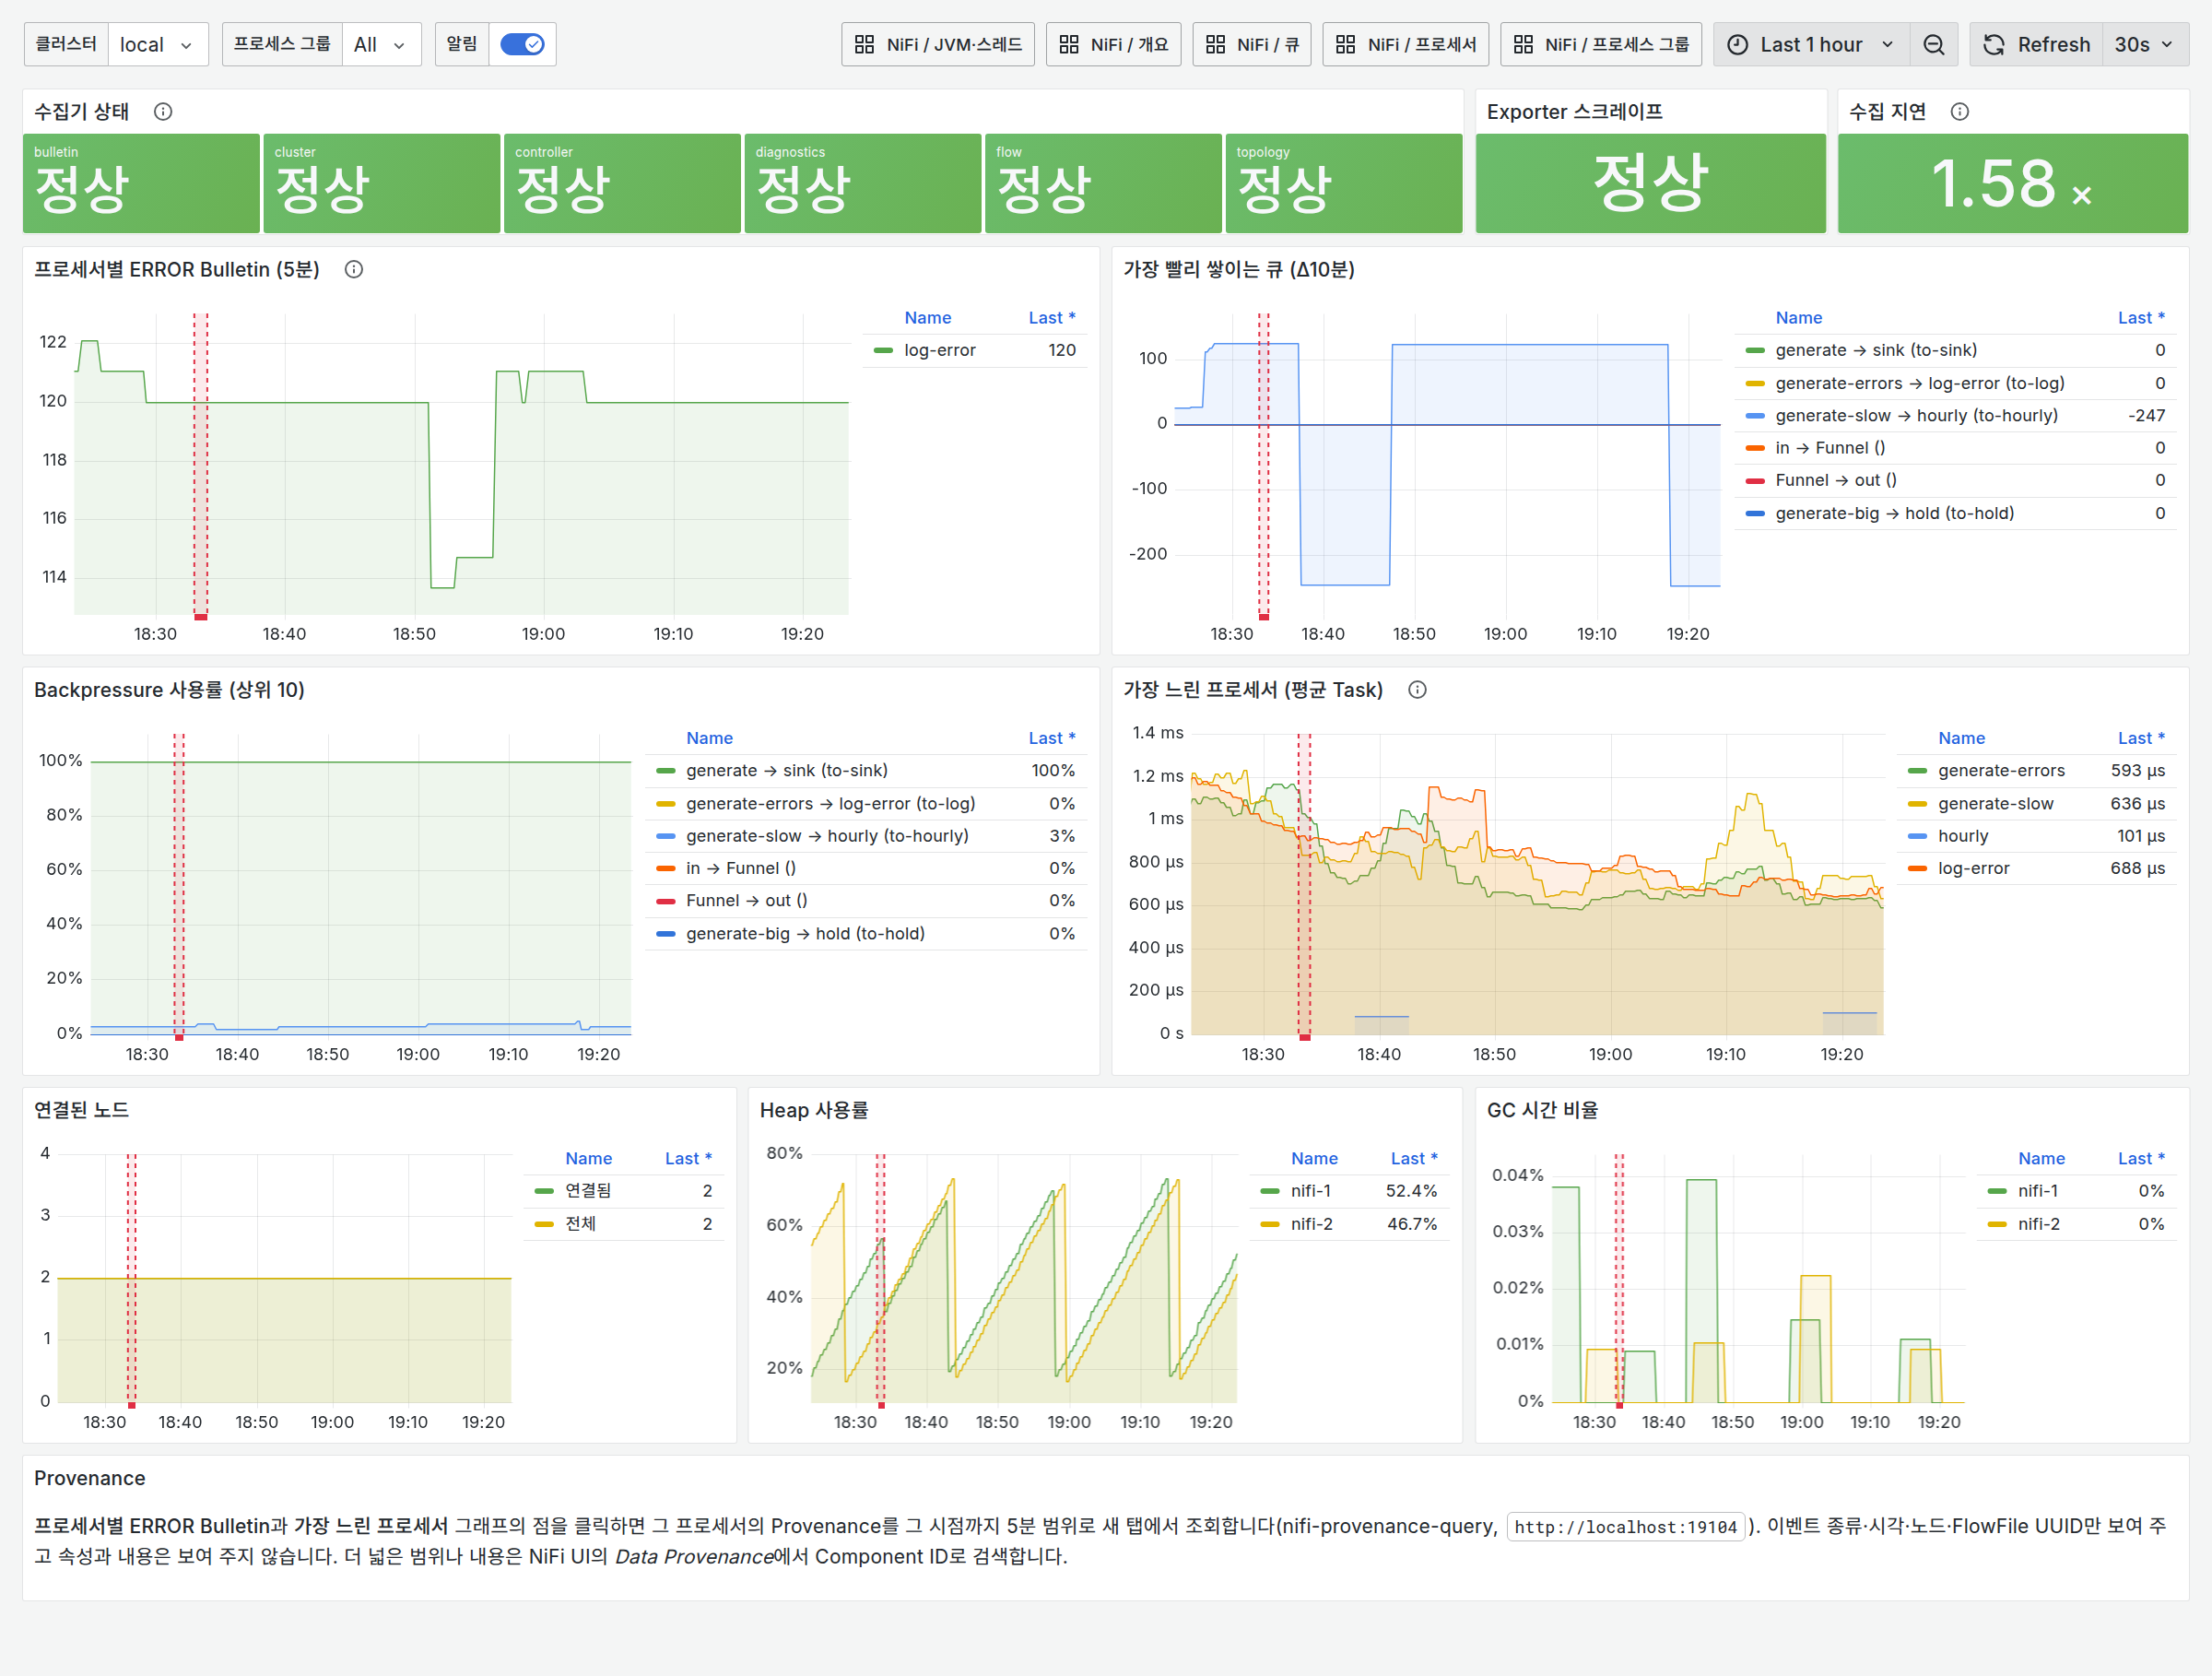
| Incident Analysis | Alert firing markers, ERRORs per processor, fastest-growing queues, slowest processors, node, heap and GC trends |
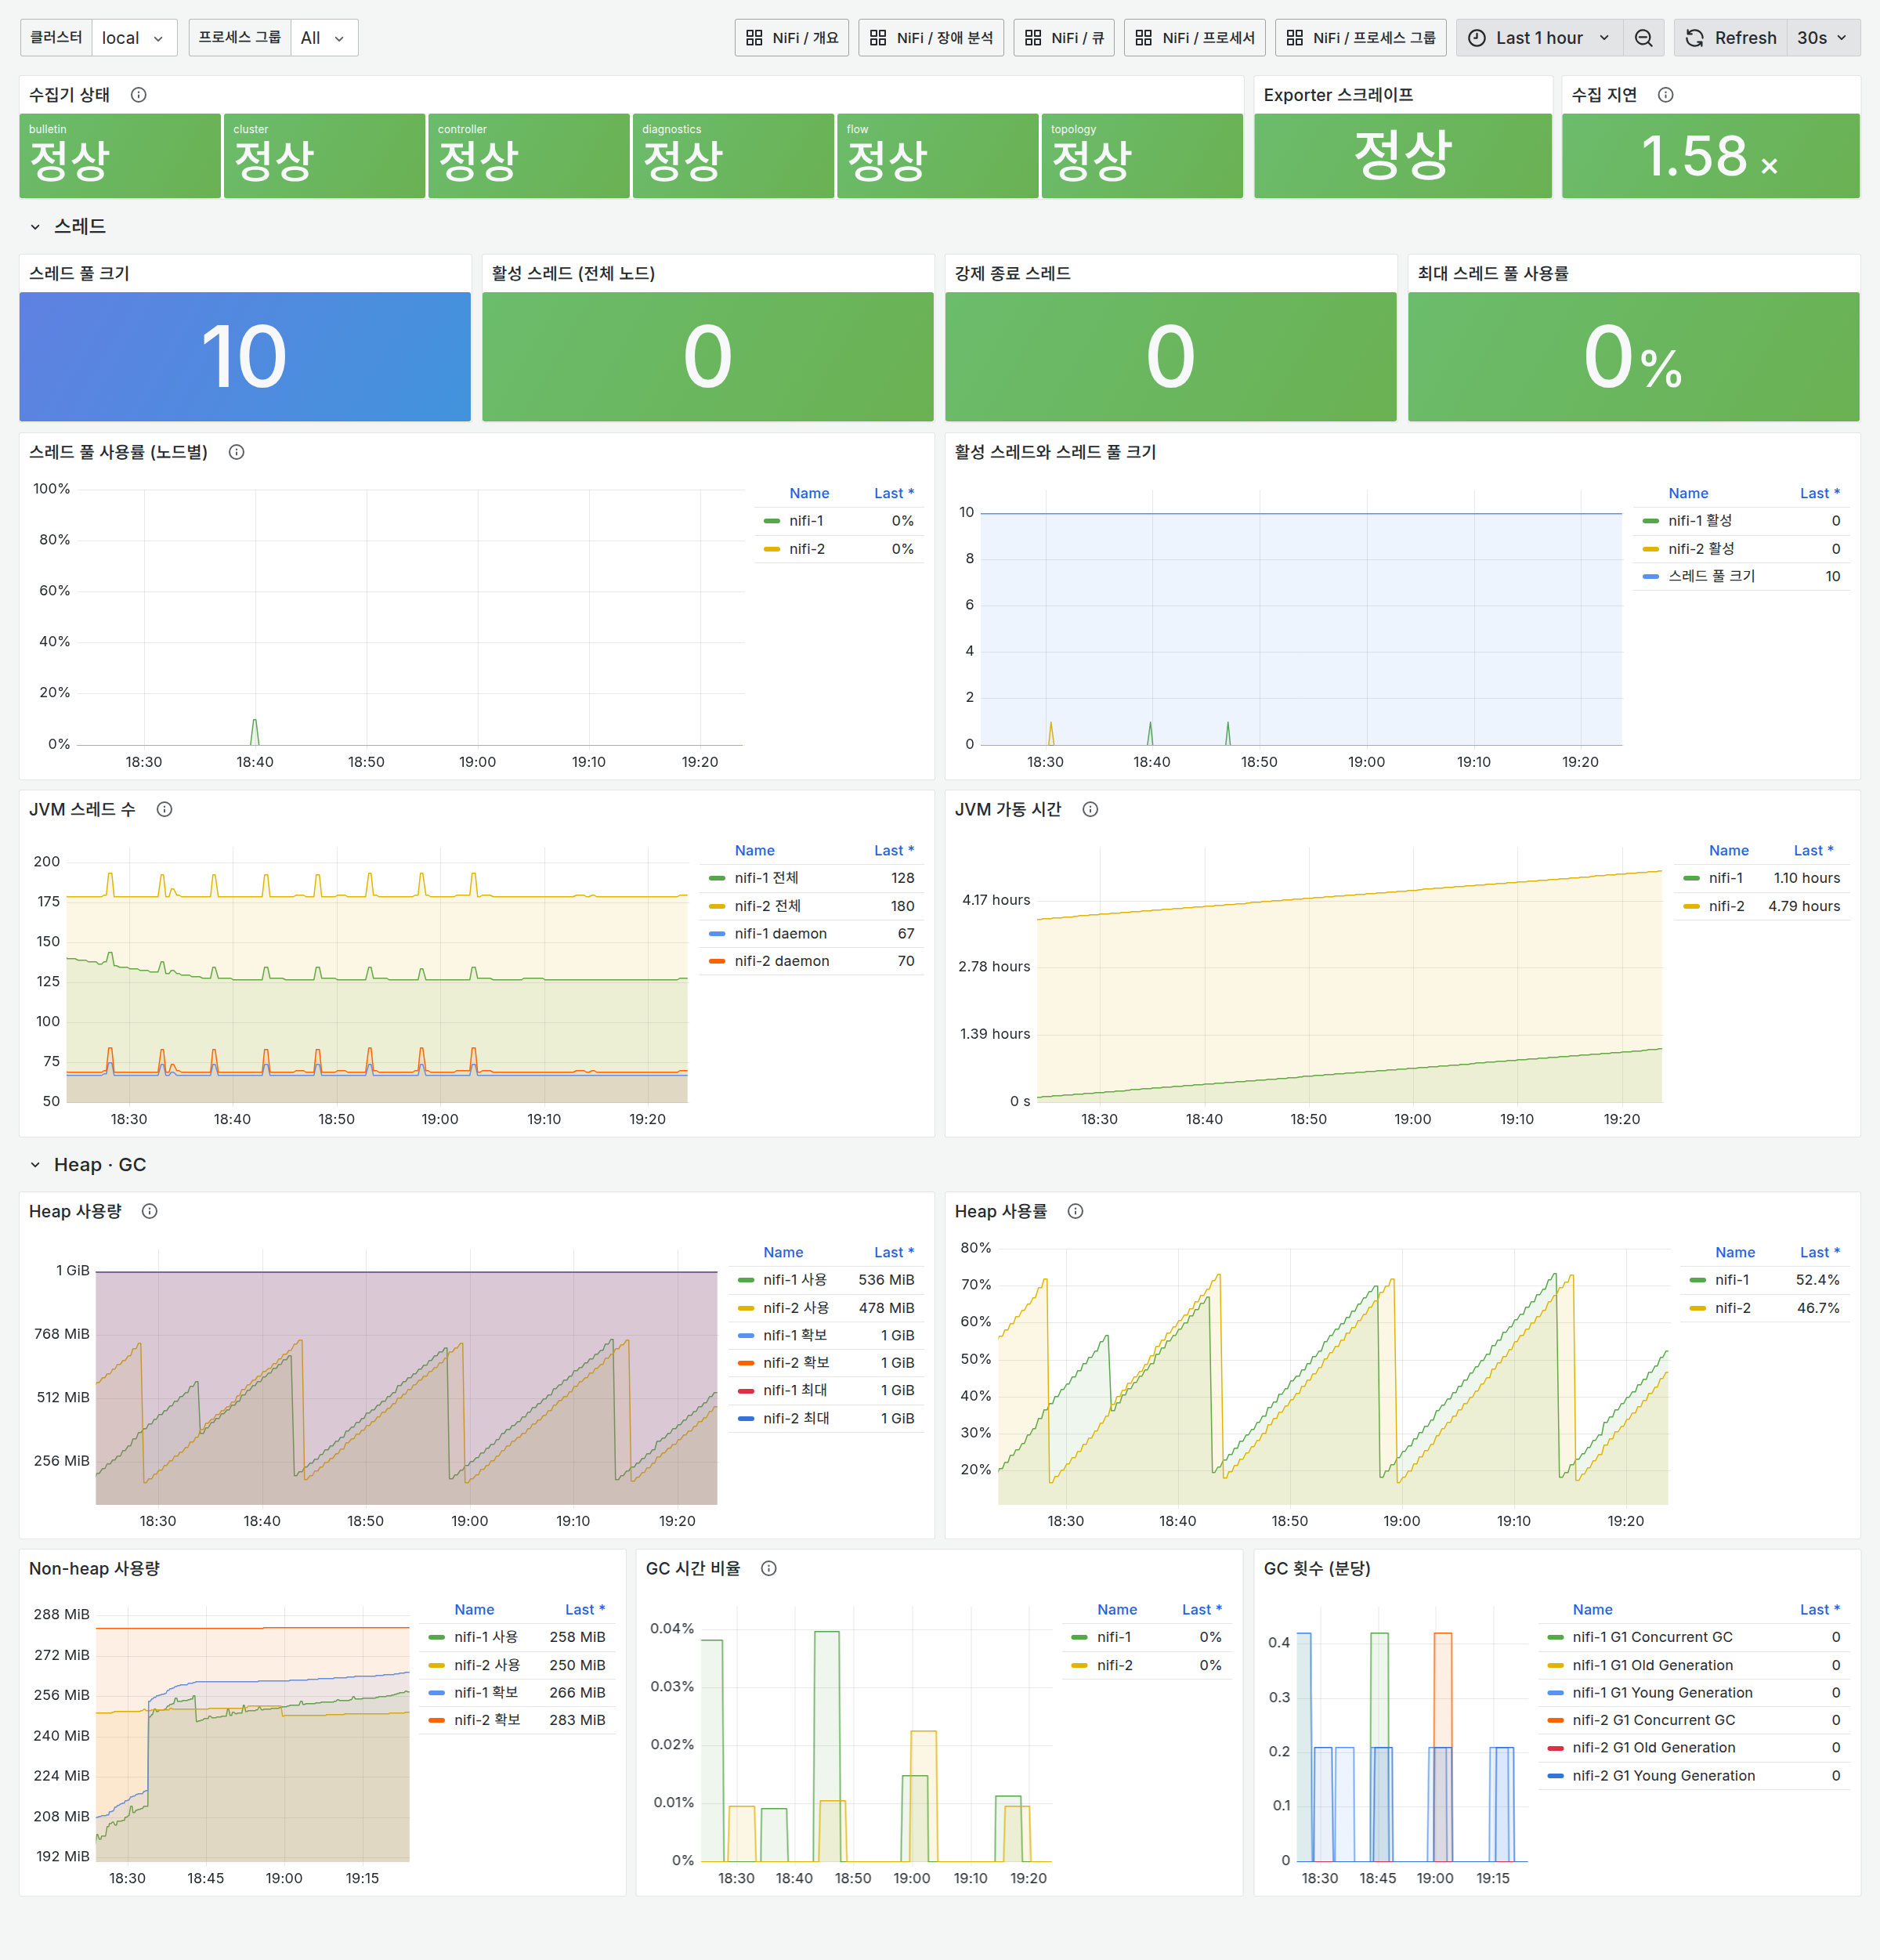
| JVM & Threads | Thread pool size, active and terminated threads, per-node pool usage, heap and non-heap, GC time ratio |
Three design principles:
- Every dashboard shows collector status at the top. FAIL means the values on that page were not collected.
- Clicking a name in a table drills down, from cluster to Process Group to processor or queue.
- Dashboards are code.
build_dashboards.pygenerates the JSON, and provisioning usesallowUiUpdates: false, so UI edits are not saved. CI checks that the generated JSON is up to date, andcheck_dashboards.pyruns every panel query against a real Grafana.
The screenshots below were taken on the local verification stack while the test flow was running.
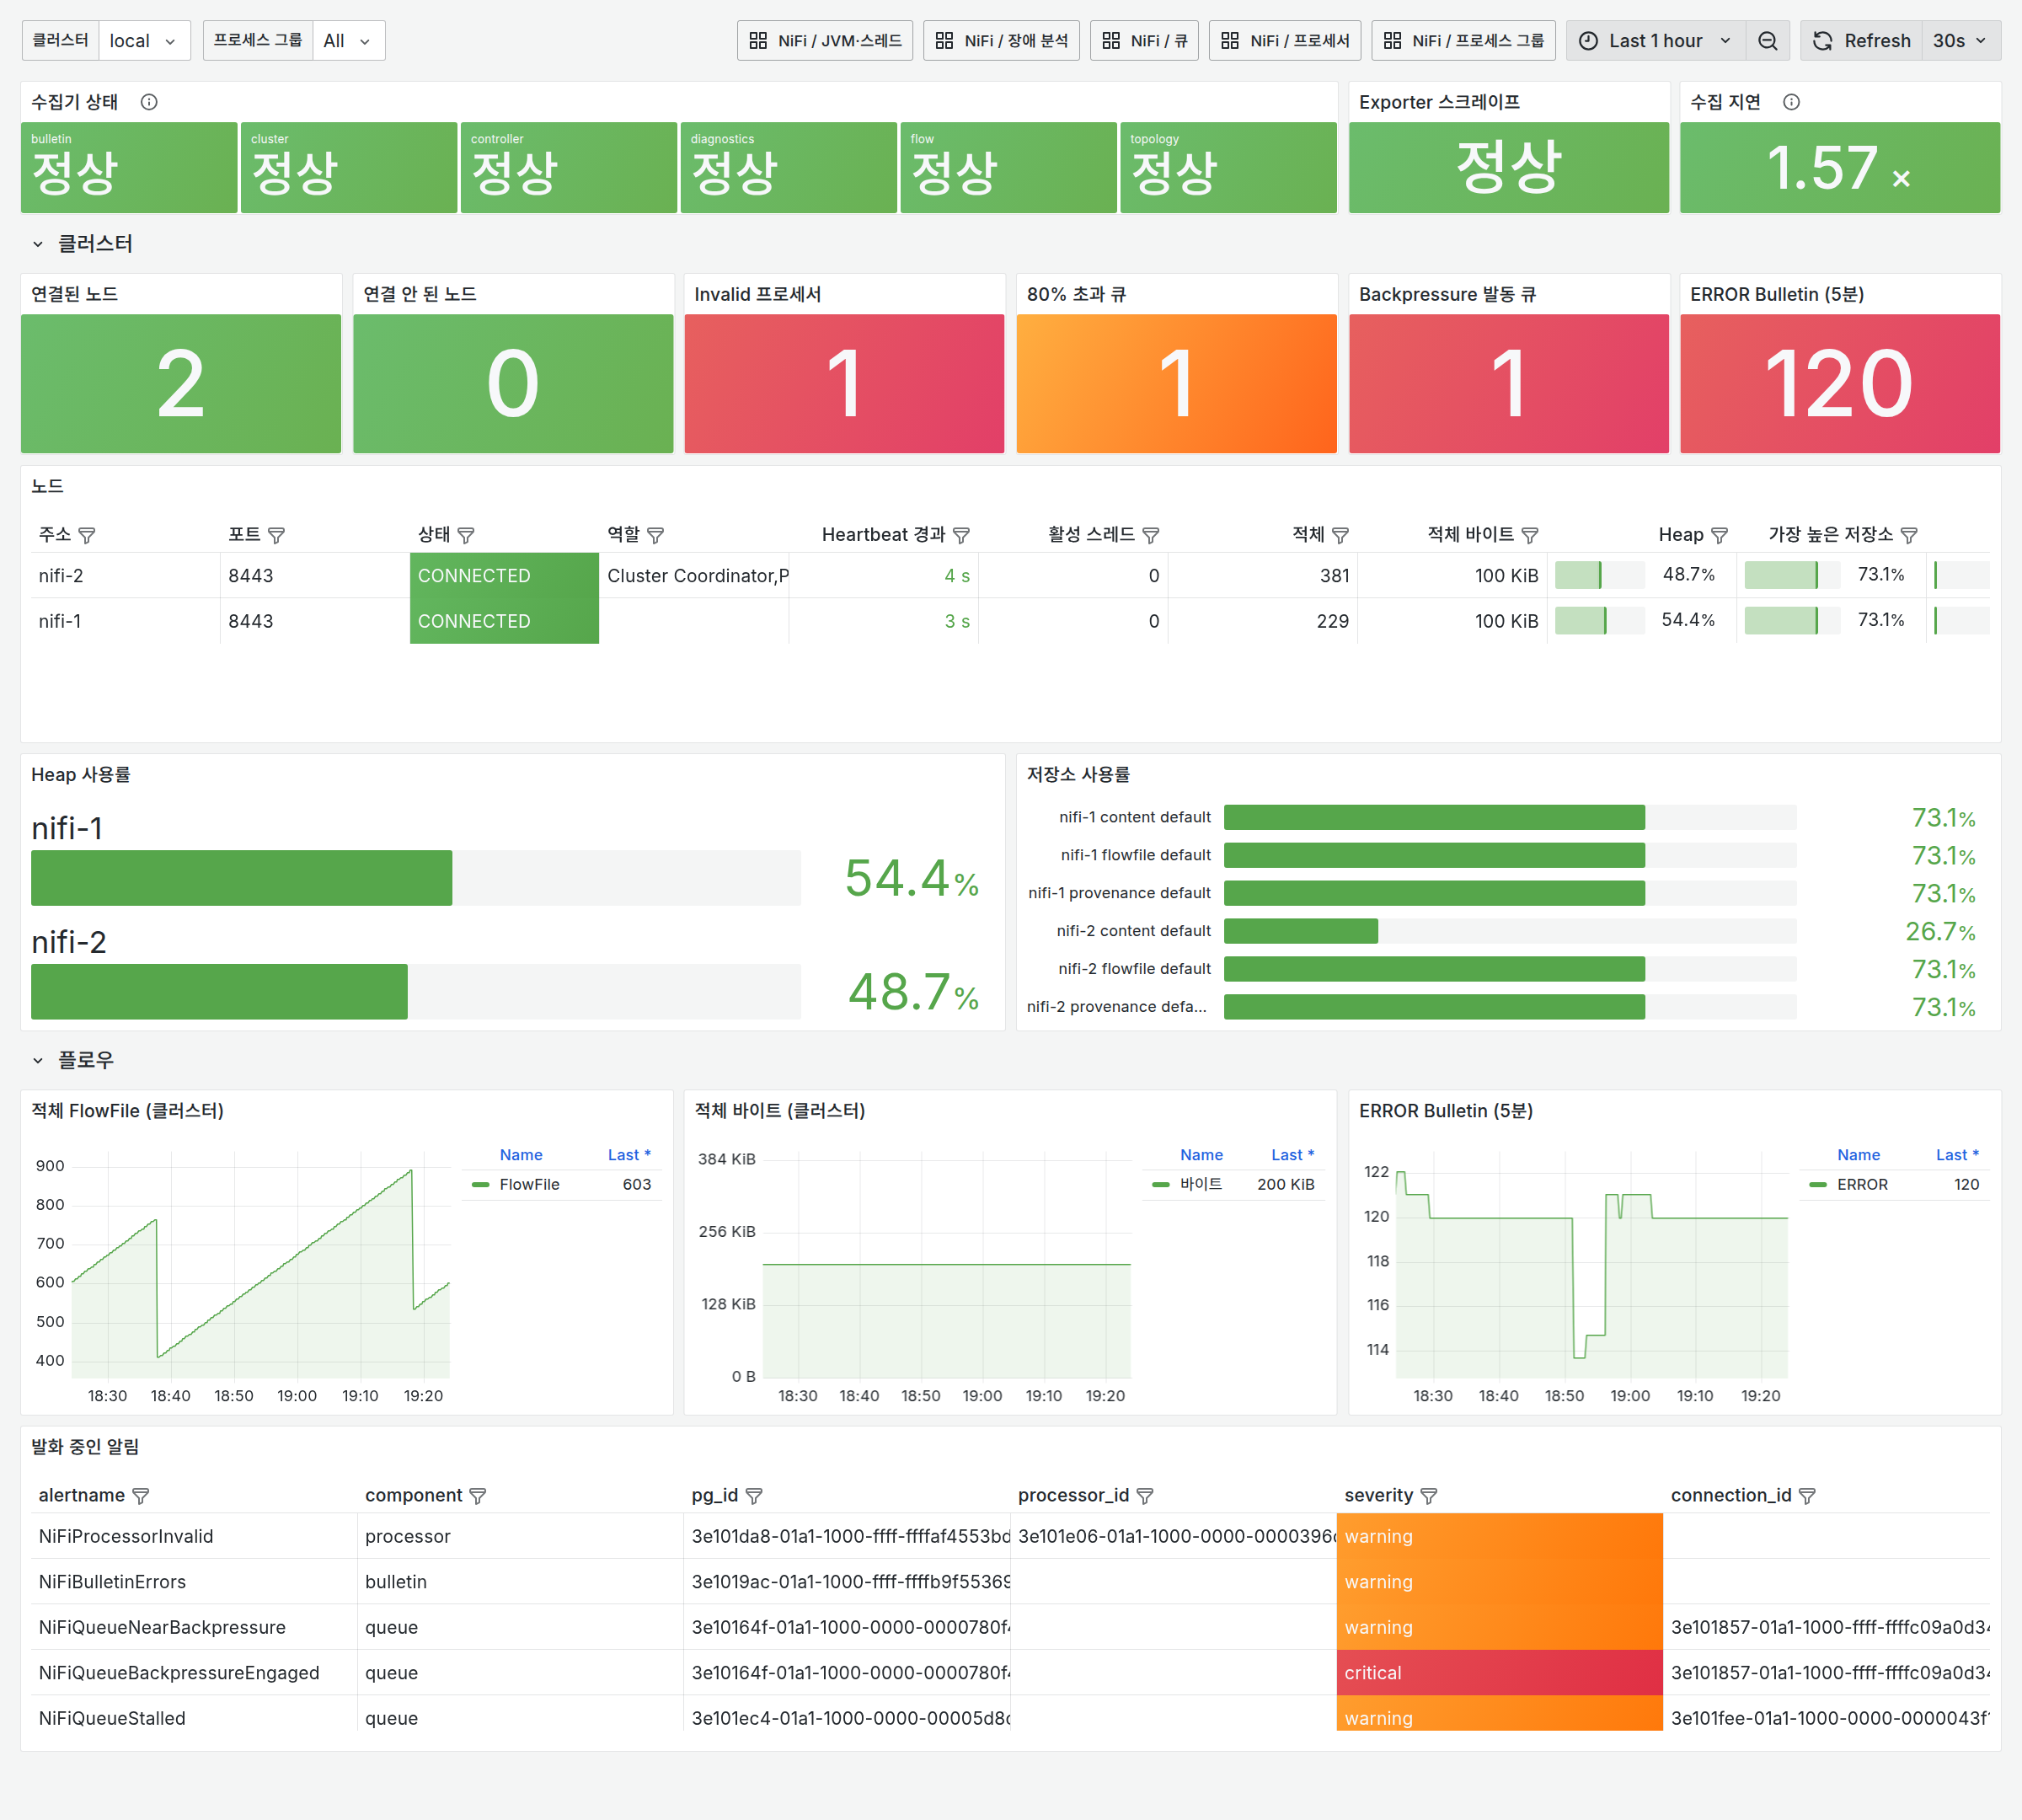
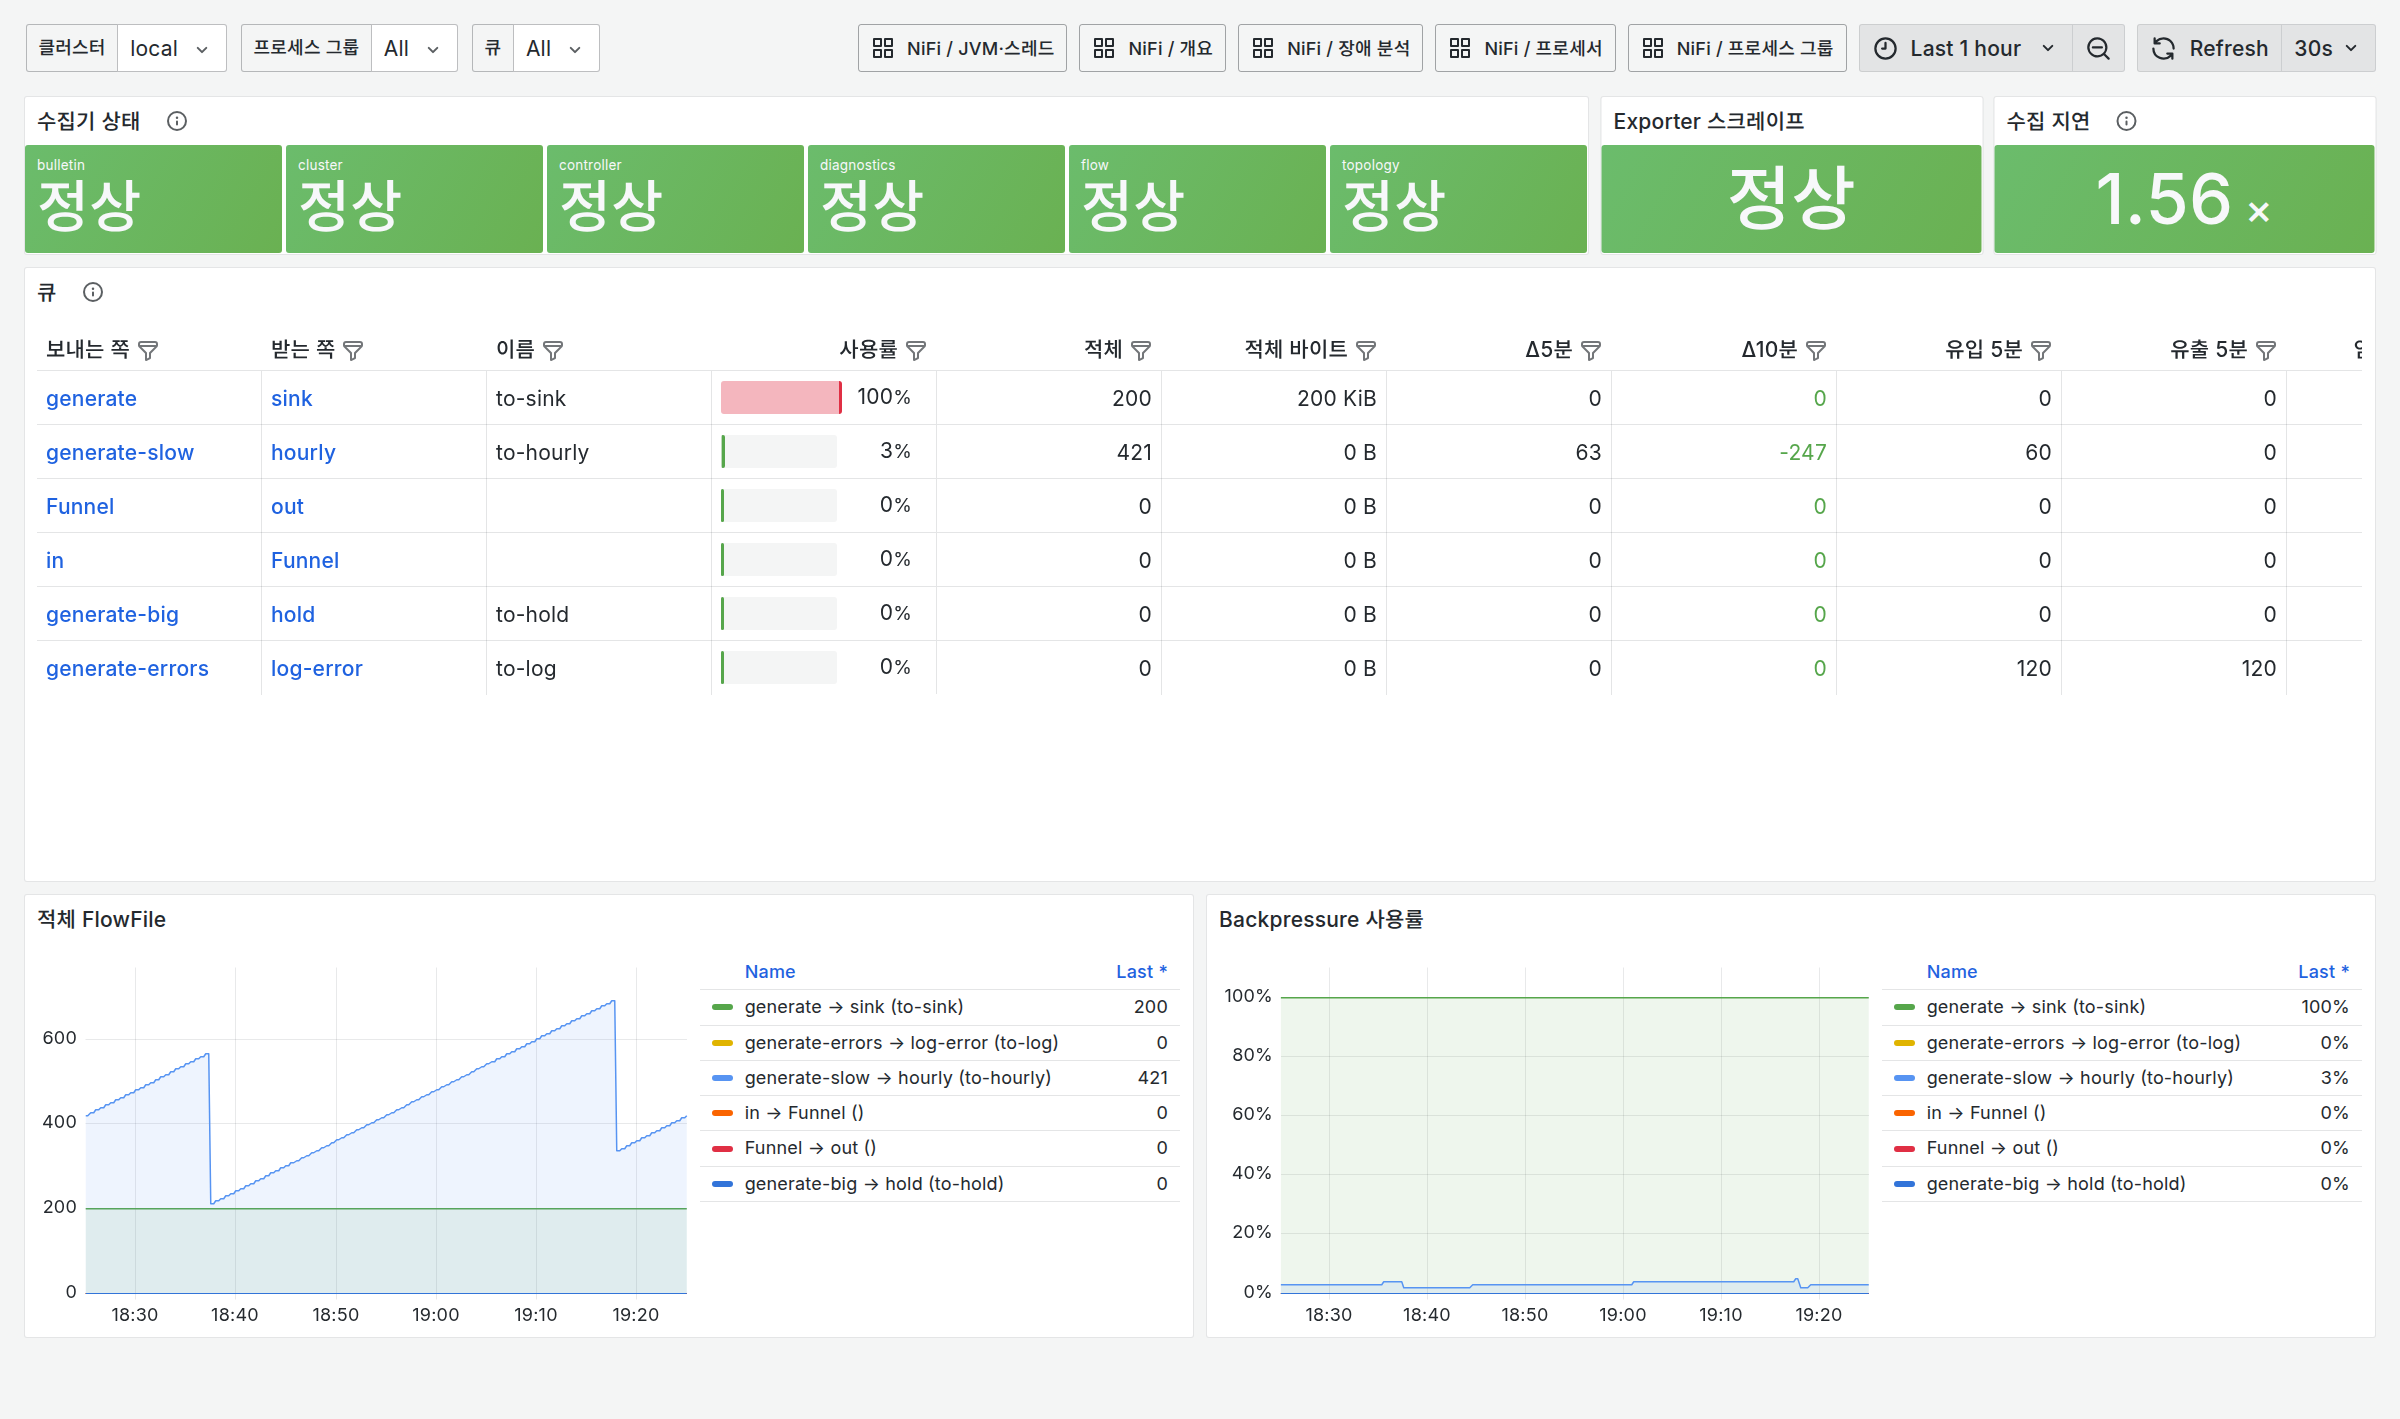
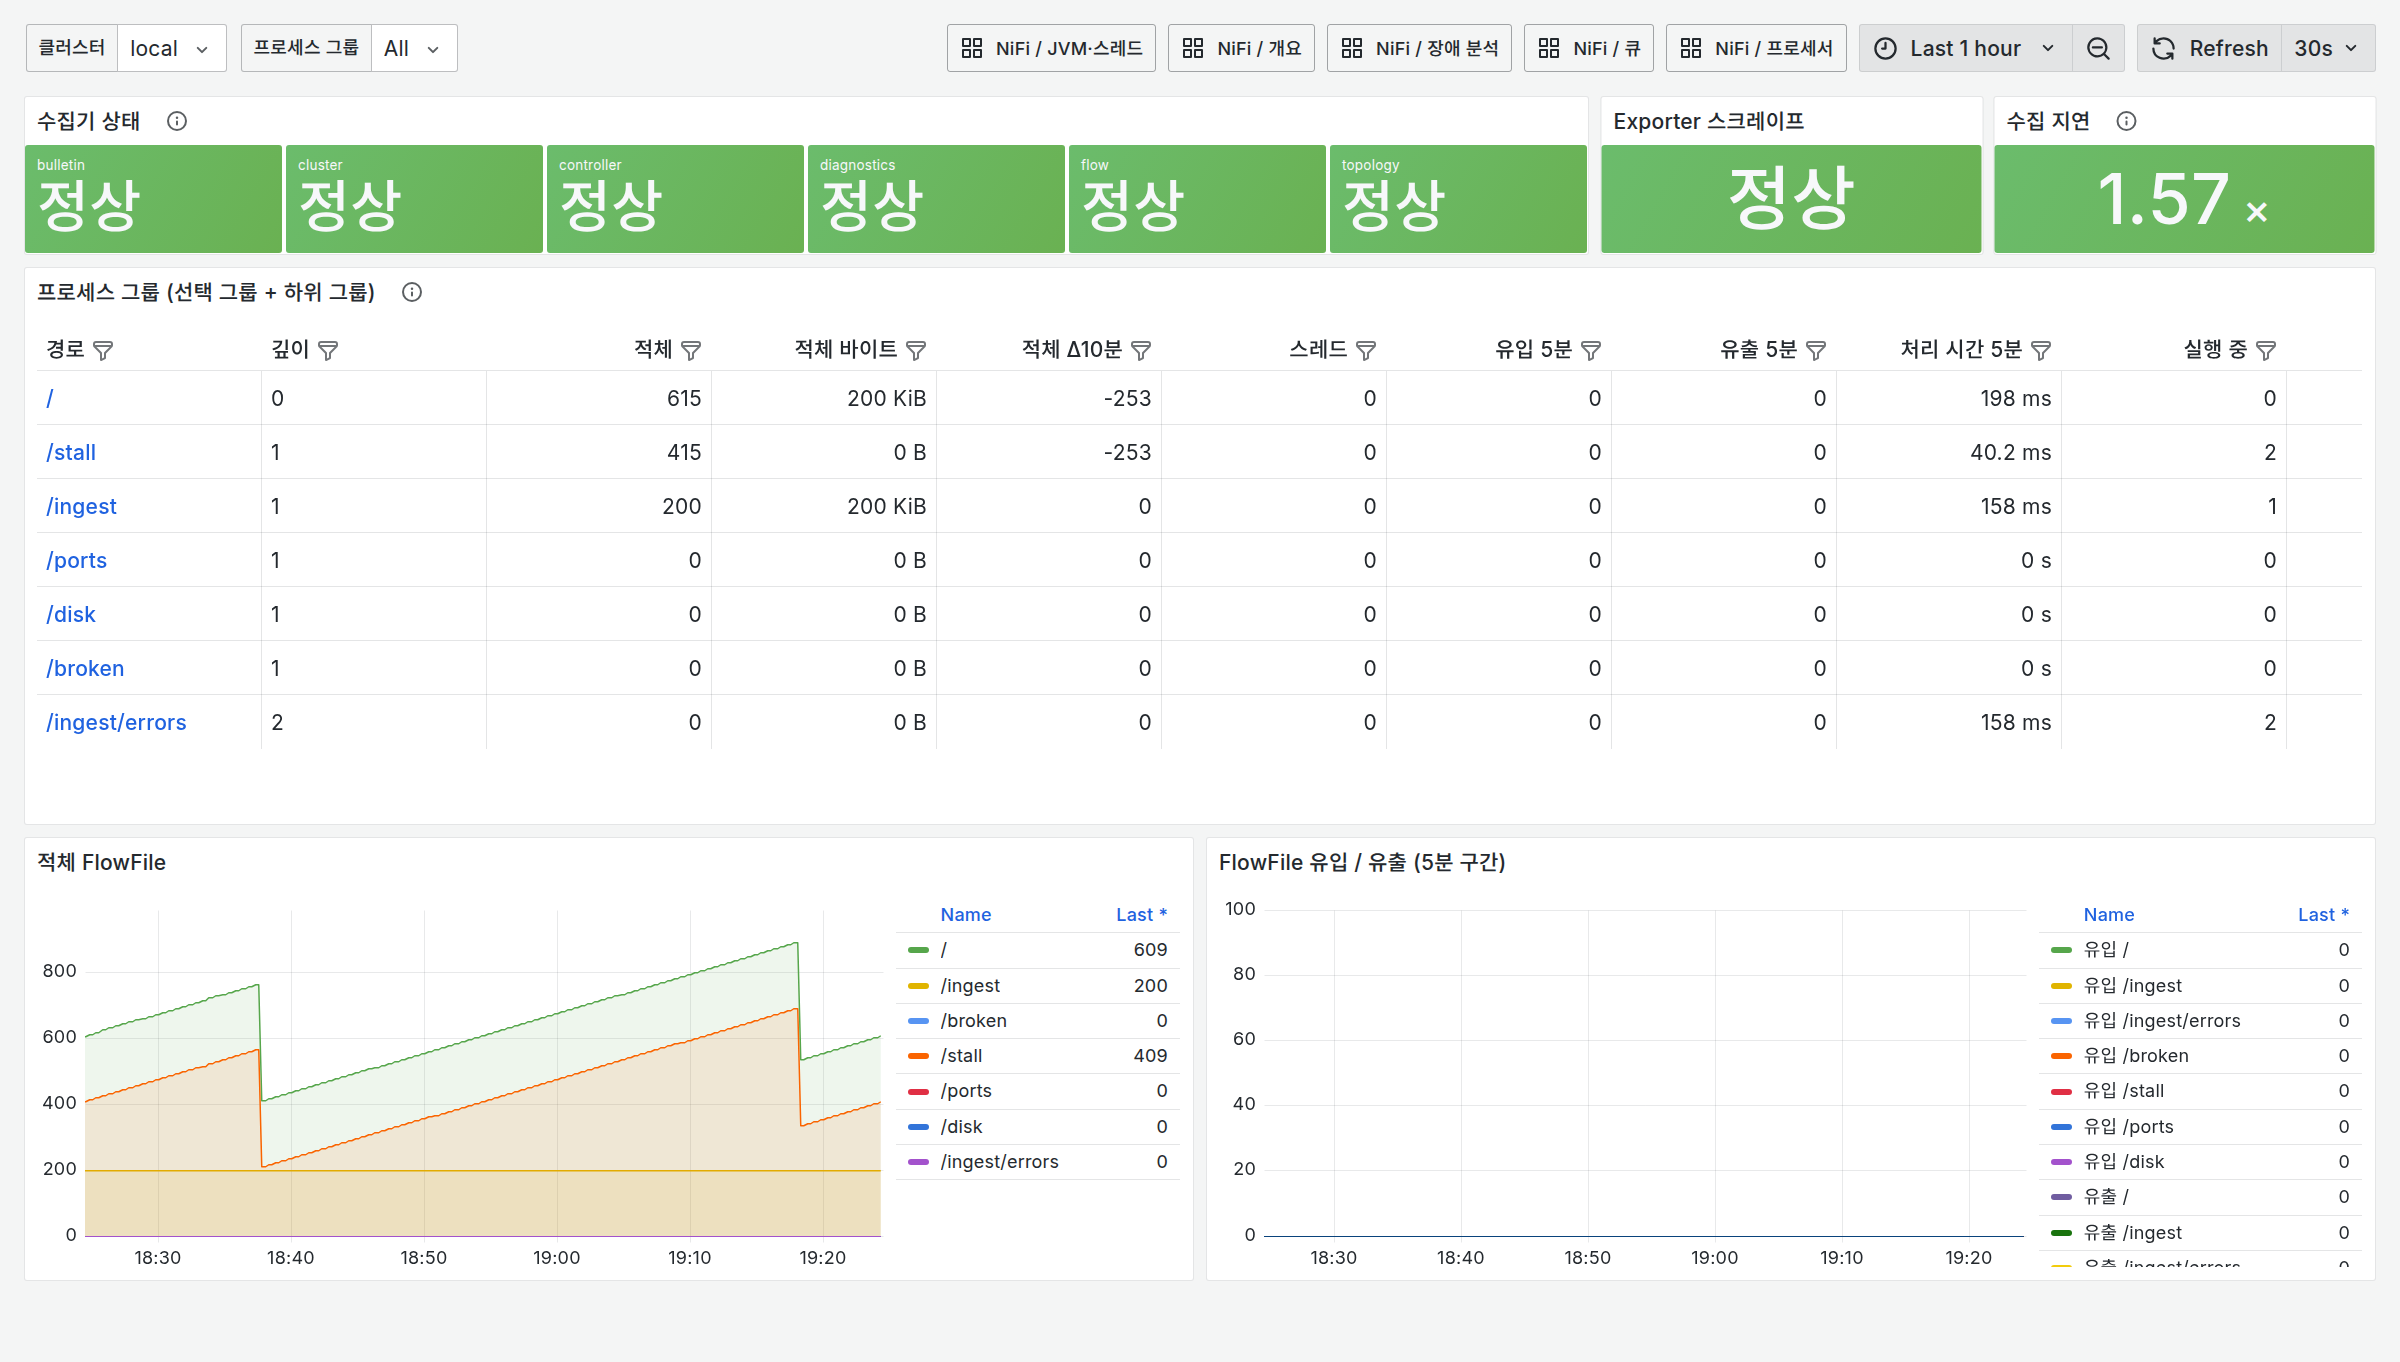
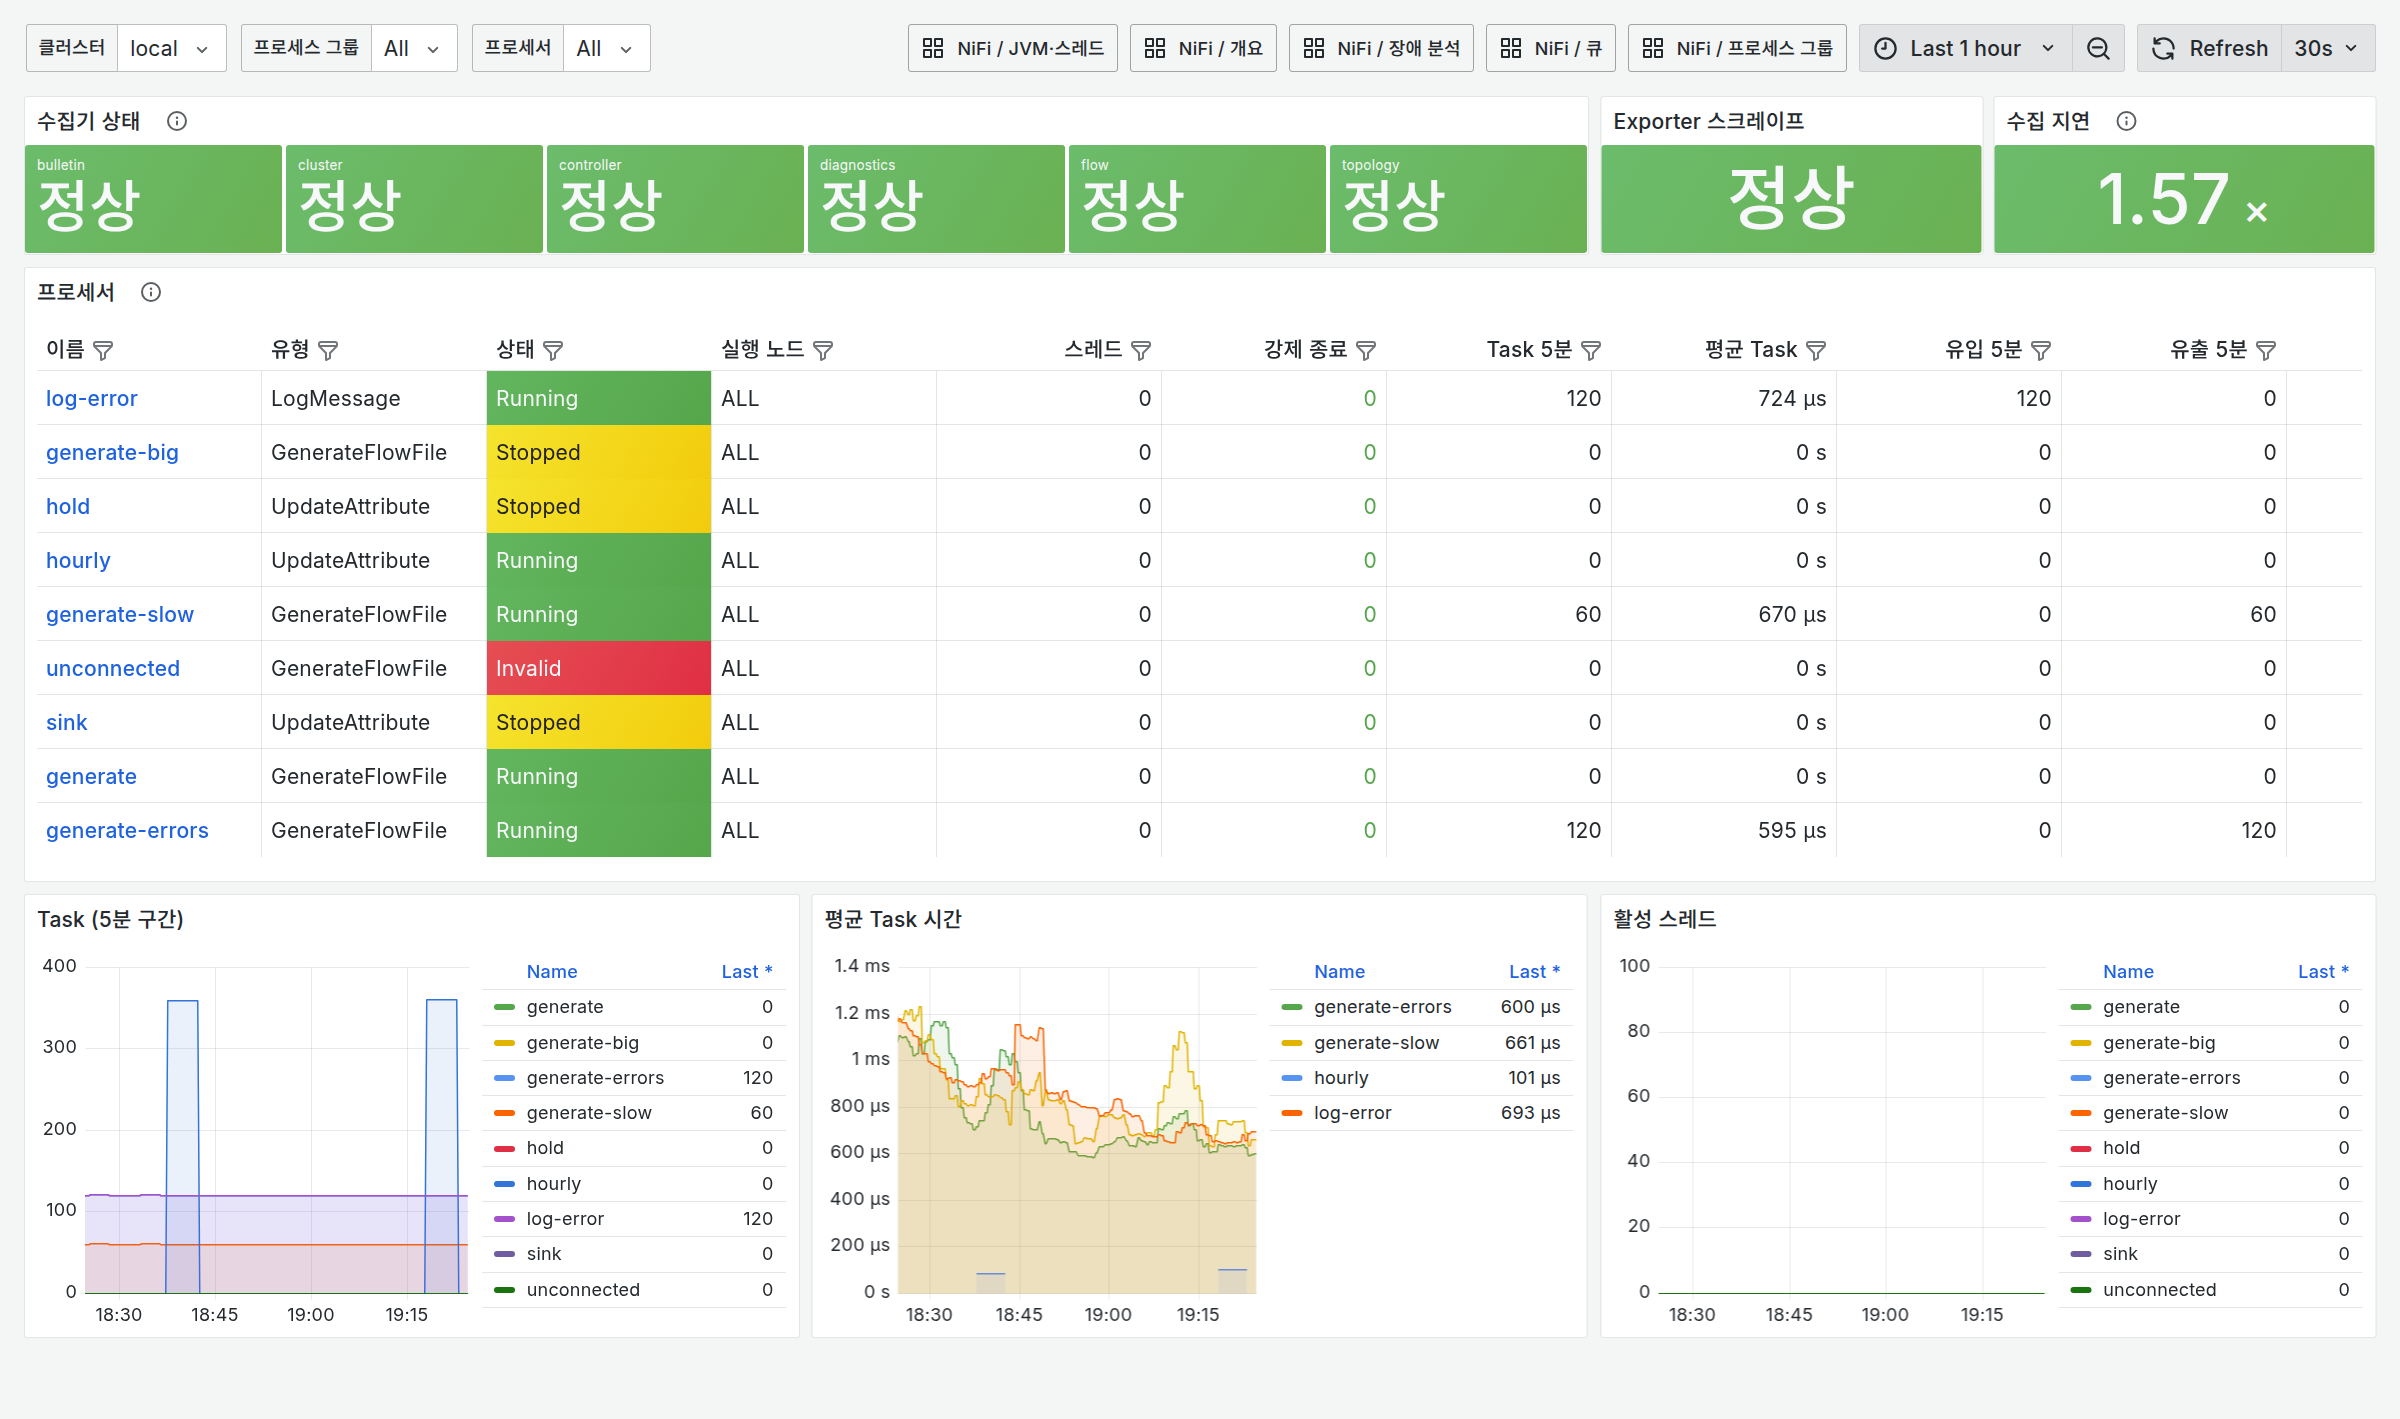
The Incident Analysis dashboard marks alert firing times with red dashed lines, so you can compare which queues grew and which processors slowed down around that moment on a single screen.
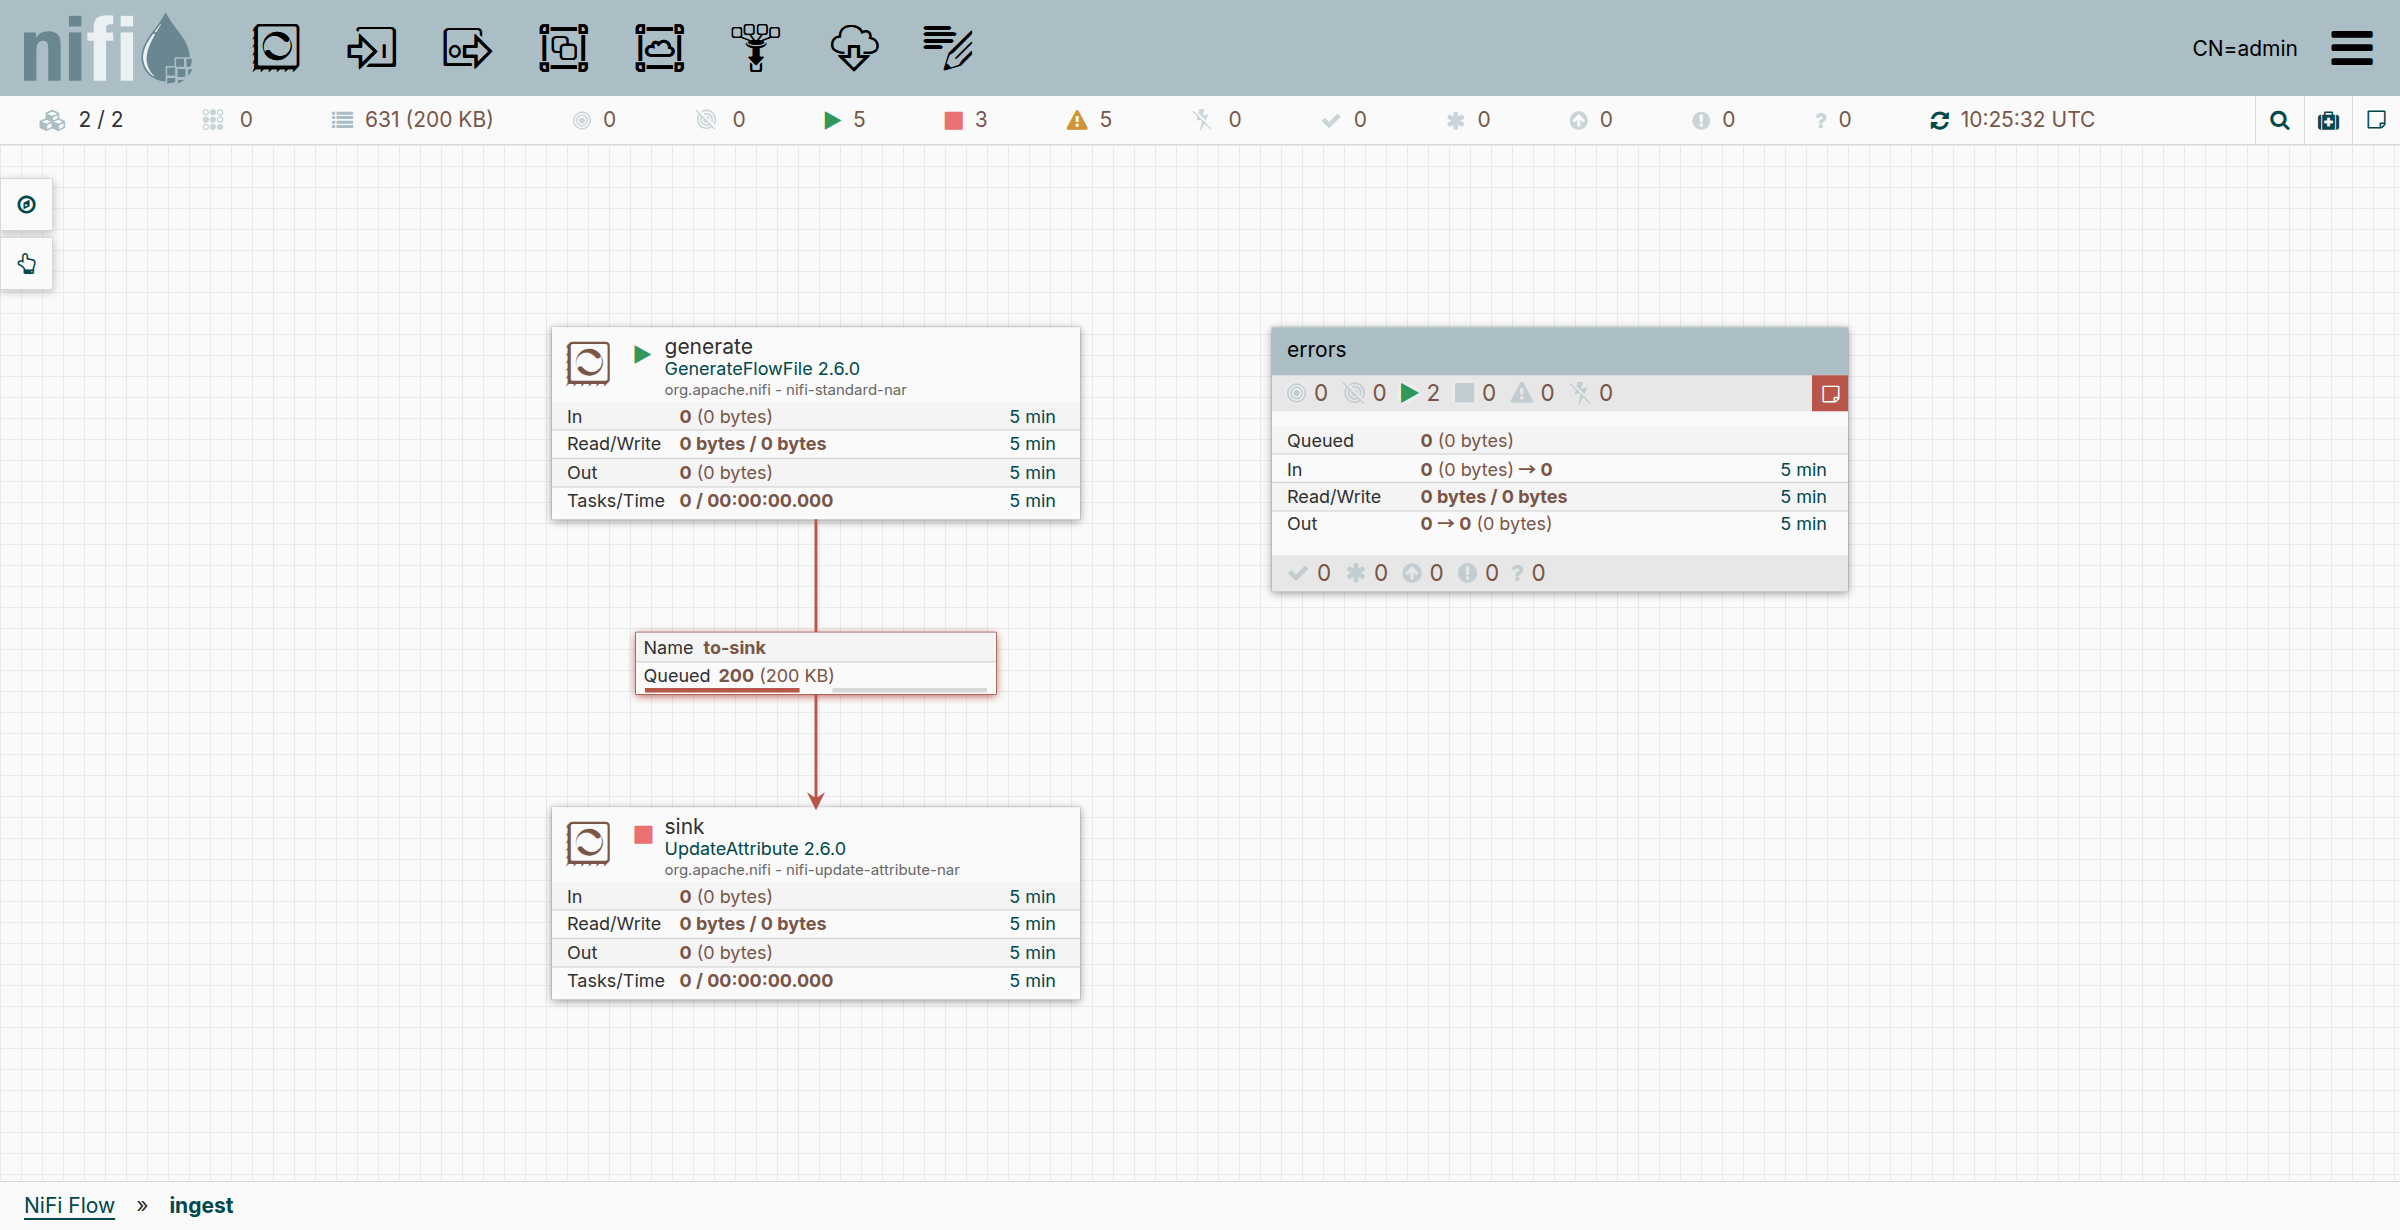
We also captured the NiFi UI at the same moment to check that dashboard values match. For example, in the ingest group below, the to-sink queue has hit its backpressure threshold (red) and the downstream sink is stopped — which shows up as 100% usage on the Queues dashboard and as the NiFiQueueBackpressureEngaged alert.
6. Click-through Provenance lookup
Metrics tell you where something is wrong, but not what happened to which FlowFile. That answer lives in NiFi Provenance — yet opening the NiFi UI mid-incident, finding the processor and setting the right time range is tedious.
nifi-provenance-query reduces that to one click. Click a point on the ERROR Bulletins per processor or slowest processors graphs in the Incident Analysis dashboard, and a new tab shows that processor's Provenance events (type, time, node, FlowFile UUID and so on) for the five minutes leading up to that point. The name menu in the processor table offers the same lookup ending at the dashboard's end time.
GET /provenance?processor_id=<UUID>&at=<epoch ms>[&window=5m][&format=json]
GET /provenance?processor_id=<UUID>&from=<time>&to=<time>
Internally the service wraps NiFi's asynchronous query API: it creates a query with POST /provenance, polls GET /provenance/{id} until it finishes, returns the result as an HTML table (or JSON), and removes the query with DELETE /provenance/{id}. The DELETE always runs, even on failure or timeout, because queries left behind in NiFi become load in their own right.
Because it talks to a production cluster, the service is tightly constrained.
| Safeguard | Detail |
|---|---|
| Required inputs | 400 without processor_id and a time range — no cluster-wide queries |
| Range limit | At most 1 hour (max_range); longer ranges are trimmed from the end and the page says so |
| Result limit | 1,000 events by default, 10,000 at most |
| Concurrency | 2 by default; more returns 429 |
| Timeout | 504 after 60 seconds, and the query is deleted |
| Data minimization | Attributes and content are never requested or returned; no view the data permission needed |
| Separate account | A lookup-only account distinct from the exporter's |
| Audit | Each lookup logs processor, range, result count and client address as JSON |
| Cluster check | 400 if the link's cluster does not match the service's cluster_name |
Missing permissions yield a 502 that names the policy required. For wider ranges or FlowFile content, move on to Data Provenance in the NiFi UI; the service focuses on answering the first question of an incident quickly.
7. The alert relay
Alertmanager handles Slack and email out of the box, but real sites always have bespoke HTTP APIs — on-call systems, ticketing, SMS gateways. Alertmanager's webhook sends a fixed JSON shape, so something has to translate.
nifi-alert-relay receives every alert through Alertmanager's custom-relay receiver and re-sends it to each configured target.
dedupe_window: 5m

targets:
  - name: ops-api
    url: https://ops.example.com/api/v1/events
    method: POST
    headers:
      Authorization: "Bearer ${OPS_API_TOKEN}"   # filled from the environment at startup
    mode: alert                                   # one request per alert
    match:
      severity: [critical]
    send_resolved: true
    timeout: 10s
    retries: 2
    retry_backoff: 2s
    payload:
      source: nifi
      title: "[{status}] {alertname} ({cluster})"
      message: "{summary}"
      detail: "{description}"
This is one target taken from the repository's exporter/config/nifi-alert-relay.example.yaml.
mode: alertsends one request per alert;mode: groupsends one per Alertmanager notification. In group mode,statusand the common labels are recomputed from the alerts left after filtering.- Without
payloadthe original body is forwarded; with it, placeholders such as{alertname},{summary}and{labels[name]}inside the JSON structure are filled in. - Only 5xx, 429 and connection errors are retried. A 4xx means the request itself is wrong, so it fails immediately.
- If any target fails, the relay returns 502 so Alertmanager retries the notification — and targets that already succeeded are skipped for
dedupe_window(5 minutes by default), so tickets are not duplicated.
How do you know when the relay itself breaks? Delivery results are exported as nifi_alert_relay_deliveries_total{target,result} and watched by NiFiAlertRelayDown and NiFiAlertRelayFailing. Those alerts also go to Slack, so a dead relay is noticed through another path.
8. Verification
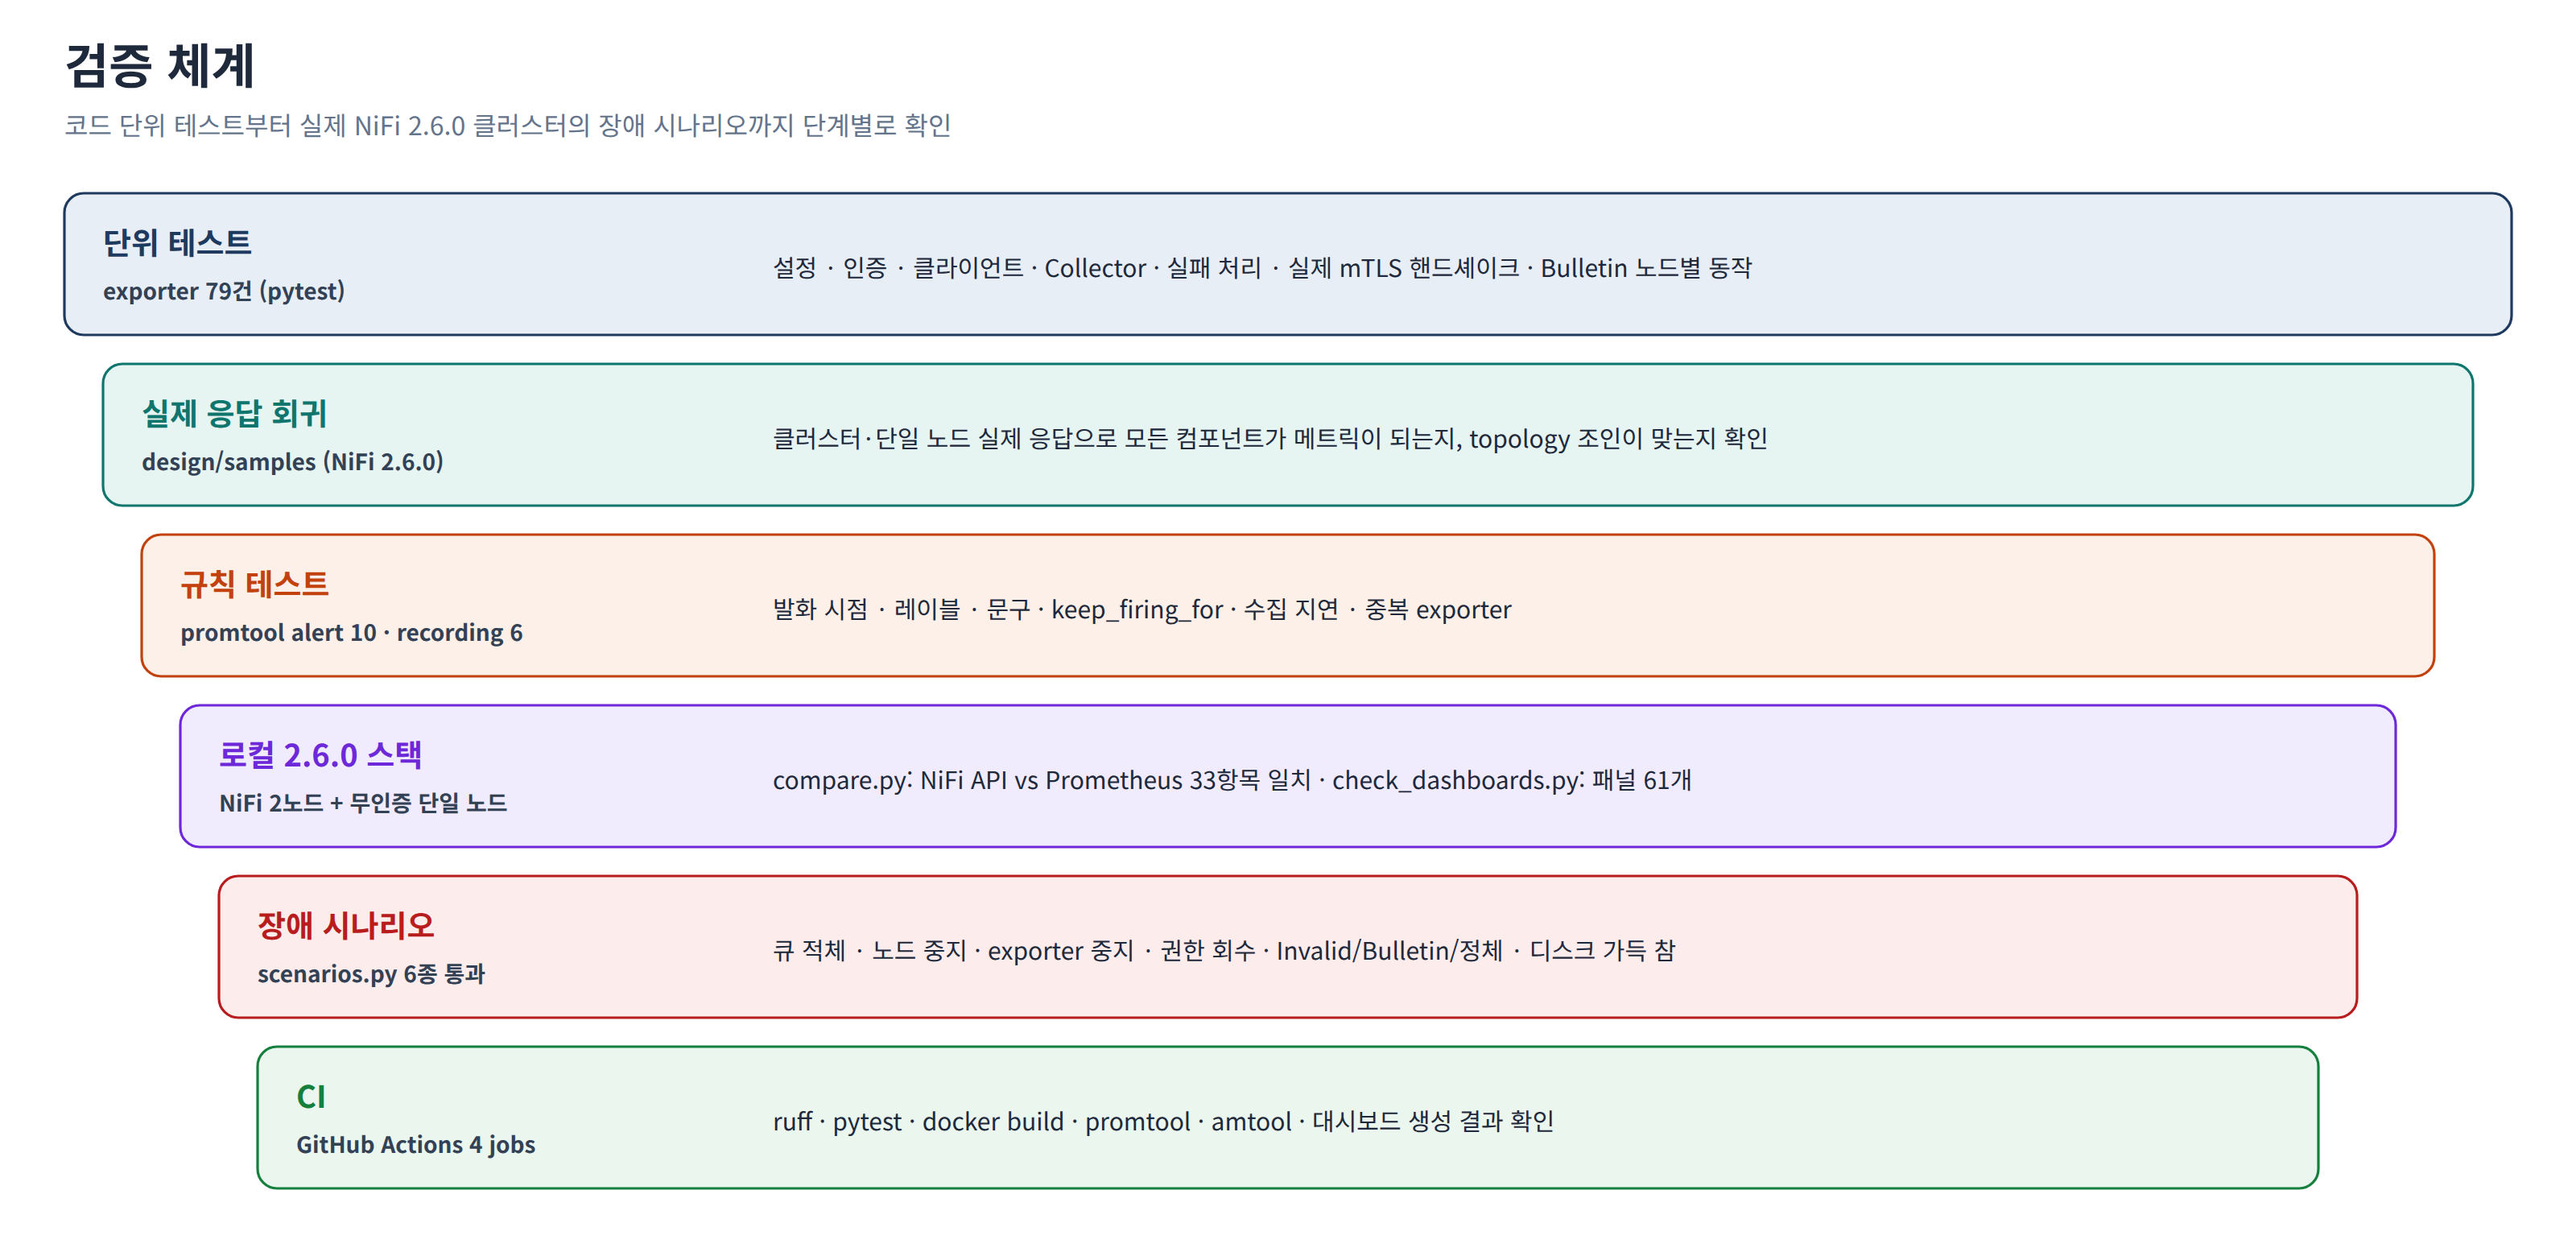
The most dangerous moment for a monitoring system is when it confidently shows a wrong number. Much of the effort in this repository went into verifying that the values are right and that alerts actually fire during failures.
| Check | Detail |
|---|---|
| Exporter unit tests (114) | Config, auth, client, collectors, standalone detection, failures and retries, a real mTLS handshake, per-node Bulletin behavior, Provenance lookup, alert relay |
| Real-response regression | Masked API responses captured from a production cluster must turn every component into metrics |
| promtool | Unit tests for 12 alert rules and 7 recording rules |
Value comparison (compare.py) | Compares NiFi API values with Prometheus directly: 33 items locally, 392 on the production CFM cluster |
Failure scenarios (scenarios.py) | Queue backlog, node stop, exporter stop, revoked permissions, invalid/Bulletin/stall, full disk |
Link clicks (check_drilldown.py) | Headless Chromium actually clicks 6 table links and 3 Provenance links |
| CI | ruff, pytest, docker build, smoke test of the script bundle, promtool, amtool, dashboard freshness |
promtool tests pin down, in code, statements like "if this series behaves like this, this alert must fire with these labels after N minutes". They stop threshold tweaks and rule edits from silently disabling alerts.
The scenario script causes real failures on the local 2-node cluster. It checks that stopping a node fires NiFiNodeDisconnected while the resulting queue alerts stay suppressed, that stopping the exporter leaves only NiFiExporterDown, and that revoking permissions raises NiFiCollectorFailing.
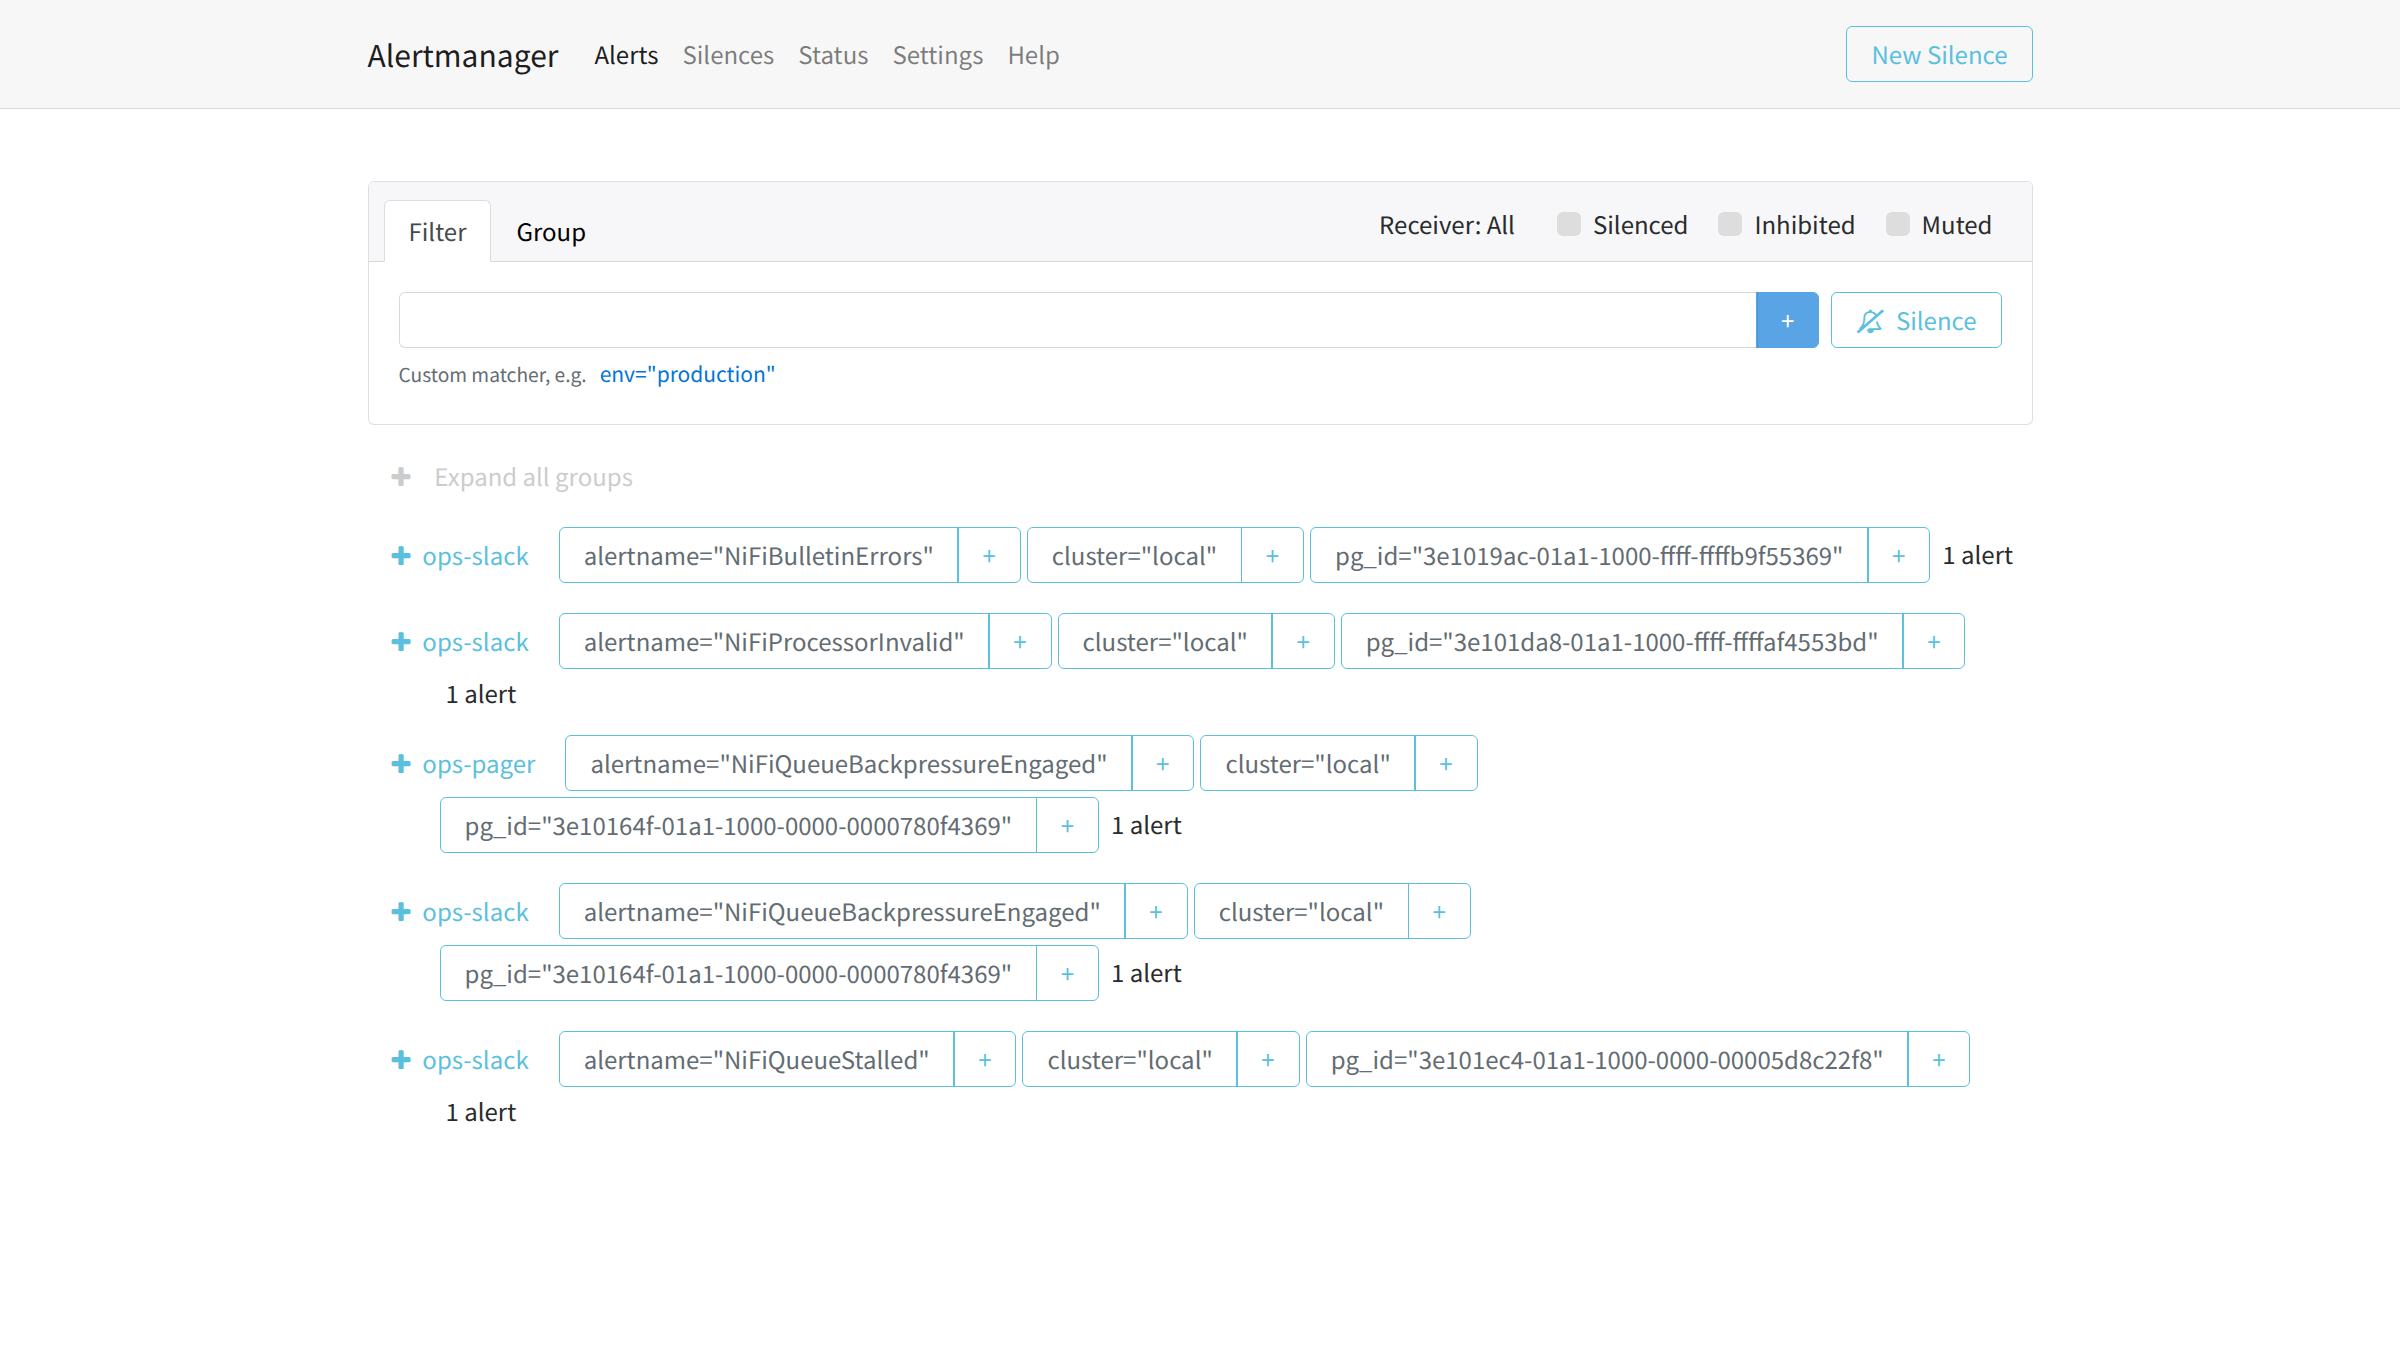
9. Try it
Local verification stack
With Docker you can bring up a 2-node NiFi 2.6.0 cluster together with the full monitoring stack.
git clone https://github.com/DataDynamics-OSS/nifi-monitoring.git
cd nifi-monitoring/deploy/local
./gen-certs.sh              # test CA, certificates and secrets
docker compose up -d        # ~1 minute until both NiFi nodes connect
python3 seed.py             # test flow, read-only account, Provenance lookup account
python3 compare.py # compare NiFi API values with Prometheus| Service | Address |
|---|---|
| Grafana | http://localhost:13000 (admin / localtest) |
| Prometheus | http://localhost:19090 |
| Alertmanager | http://localhost:19093 |
| nifi-exporter | http://localhost:19103/metrics |
| NiFi | https://localhost:18443/nifi (import certs/admin.p12 into your browser) |
The test flow deliberately creates queue backlog, an invalid processor, ERROR Bulletins and a stalled consumer, so alerts start firing within a few minutes. For a standalone NiFi without TLS or auth, use docker compose --profile plain up -d nifi-plain nifi-exporter-plain.
Production install
cd exporter
docker build -t nifi-exporter:0.1.0 .
cp config/nifi-exporter.example.yaml /etc/nifi-exporter/config.yaml   # edit
docker run -d --name nifi-exporter -p 9103:9103 \
  -v /etc/nifi-exporter:/etc/nifi-exporter:ro \
  nifi-exporter:0.1.0
Servers without Docker are covered too.
- INSTALL.md is a step-by-step guide using a Python venv and systemd, with a check command and troubleshooting for each step, including how to bring files into an air-gapped network. (It is written in Korean.)
make distbuilds a bundle you simply unpack and start withbin/start.sh— no pip or venv. The server needs only Python 3.11, and it runs withpython -Sso it never mixes with system site-packages.
Prometheus, Alertmanager and Grafana configs live under deploy/ and can be validated before rollout with promtool check/test and amtool check-config. Requirements are Prometheus 2.42+ (keep_firing_for) and Grafana 11.6+ (where drill-down links into the same dashboard take effect immediately).
10. Lessons from operations
One exporter per cluster. It is tempting to run two exporters for availability, but if two exporters for the same cluster are scraped, every *_info series is duplicated and the group_left joins fail — queue, processor and Bulletin alerts all go silent. Availability therefore comes from a restarting runtime (systemd Restart=always, Kubernetes replicas: 1), and NiFiExporterDuplicate fires if two ever get attached.
One time zone everywhere. The monitoring server OS, the NiFi servers and JVMs, the exporter's nifi.timezone and the Grafana dashboards are all set to Asia/Seoul. NiFi reports heartbeat times as strings in the server's time zone; if the exporter parses them in a different zone, heartbeat age is off by the offset and NiFiNodeHeartbeatStale fires for no reason.
Collection alerts first, node alerts next. This is the runbook's first rule. While a collection alert is firing, empty dashboard values mean "not collected", not "0"; and queue backlog during a node disconnect is most likely a consequence. Queue alerts are narrowed down in the order Queues dashboard → downstream processor → Bulletins → Provenance.
Upgrade NiFi by diffing responses first. Capture the new version's API responses with capture_samples.py, diff them against the previous ones, run the regression tests on masked samples (mask_samples.py), then bump the NiFi image in the local stack and rerun the value comparison and failure scenarios. REST response shapes drift slightly between versions.
/metrics is sensitive too. Queue and processor names carry business information. Enable server.basic_auth or restrict access to the internal network, and manage certificates for NiFi's built-in endpoint with the same care.
Wrapping up
nifi-monitoring started from a simple goal: know about failures even when nobody is watching the NiFi UI. The parts that took the most care were not the dashboards but the mechanisms that make the numbers trustworthy — distinguishing "not collected" from zero, letting cause alerts suppress their effects, preventing false resolutions, and comparing 392 values on a production cluster.
If you run NiFi 2.x, start with the local stack. Issues and pull requests are always welcome.
- GitHub: github.com/DataDynamics-OSS/nifi-monitoring
- License: Apache License 2.0
- Alert runbook: docs/runbook.md