
ScatterSharp
A C#/.NET scatter chart library for large sensor datasets. Save and restore ChartModel data, styles and viewport in .chart files, with Python integration and a separate Canvas web viewer.
From chart model to saved and rendered output
Save a ChartModel containing data, styles and viewport, then use it for native displays, file exports and a separate web viewer.
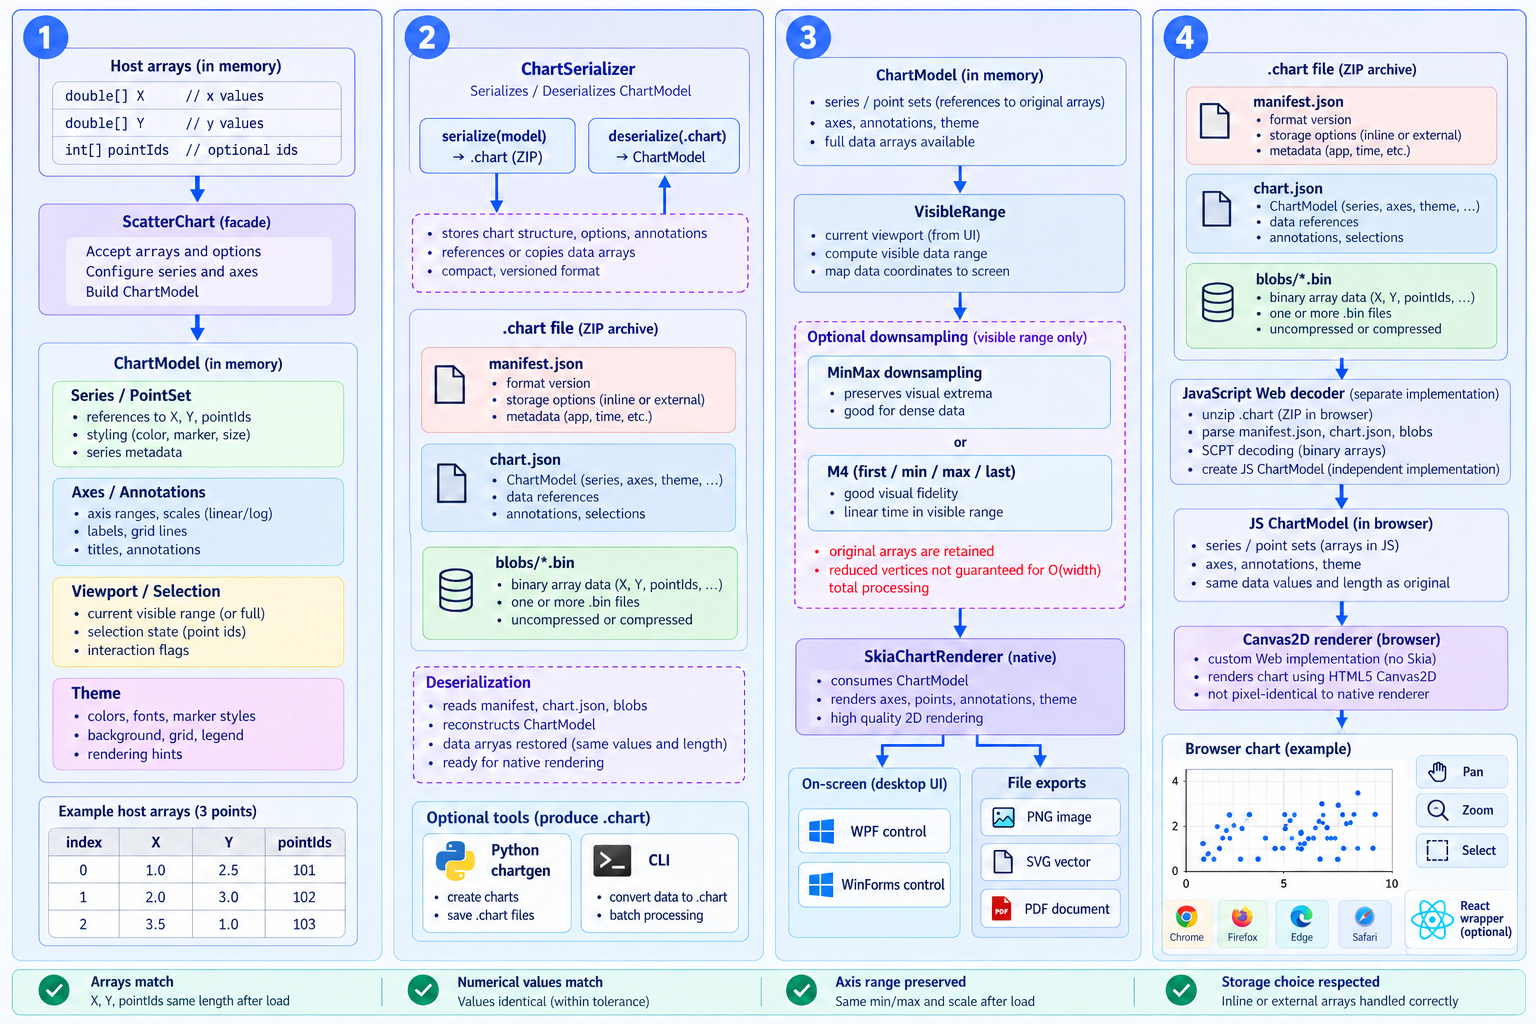
- 1.Build the chart model
- Use ScatterChart APIs to define series, points, axes, annotations, viewport and selection. Uniform X uses start and interval values; optional PointIds associate points with source identifiers.
- 2.Save and restore state
- ChartSerializer writes manifest.json, chart.json and blobs/*.bin into a .chart ZIP. Large coordinate arrays use binary storage with configurable precision and compression.
- 3.Select the view and render
- ChartRenderer computes layout and scales, applies VisibleRange and downsampling such as MinMax or M4, then draws series and overlays through IRenderSurface.
- 4.Display and interact
- Native hosts and PNG, SVG and PDF exports use Skia. Input flows through ChartInteraction; the web viewer decodes .chart and displays it with a separate Canvas2D engine.
WPF, WinForms and headless exports share Skia. Web Canvas is a separate implementation reading the same .chart format; pixel equality between renderers is not guaranteed.
View GitHub documentation and codeFrom Python data to a web chart
Python prepares data and options, chartgen produces .chart and optional PNG files, and the web example moves from an image preview to an interactive chart.
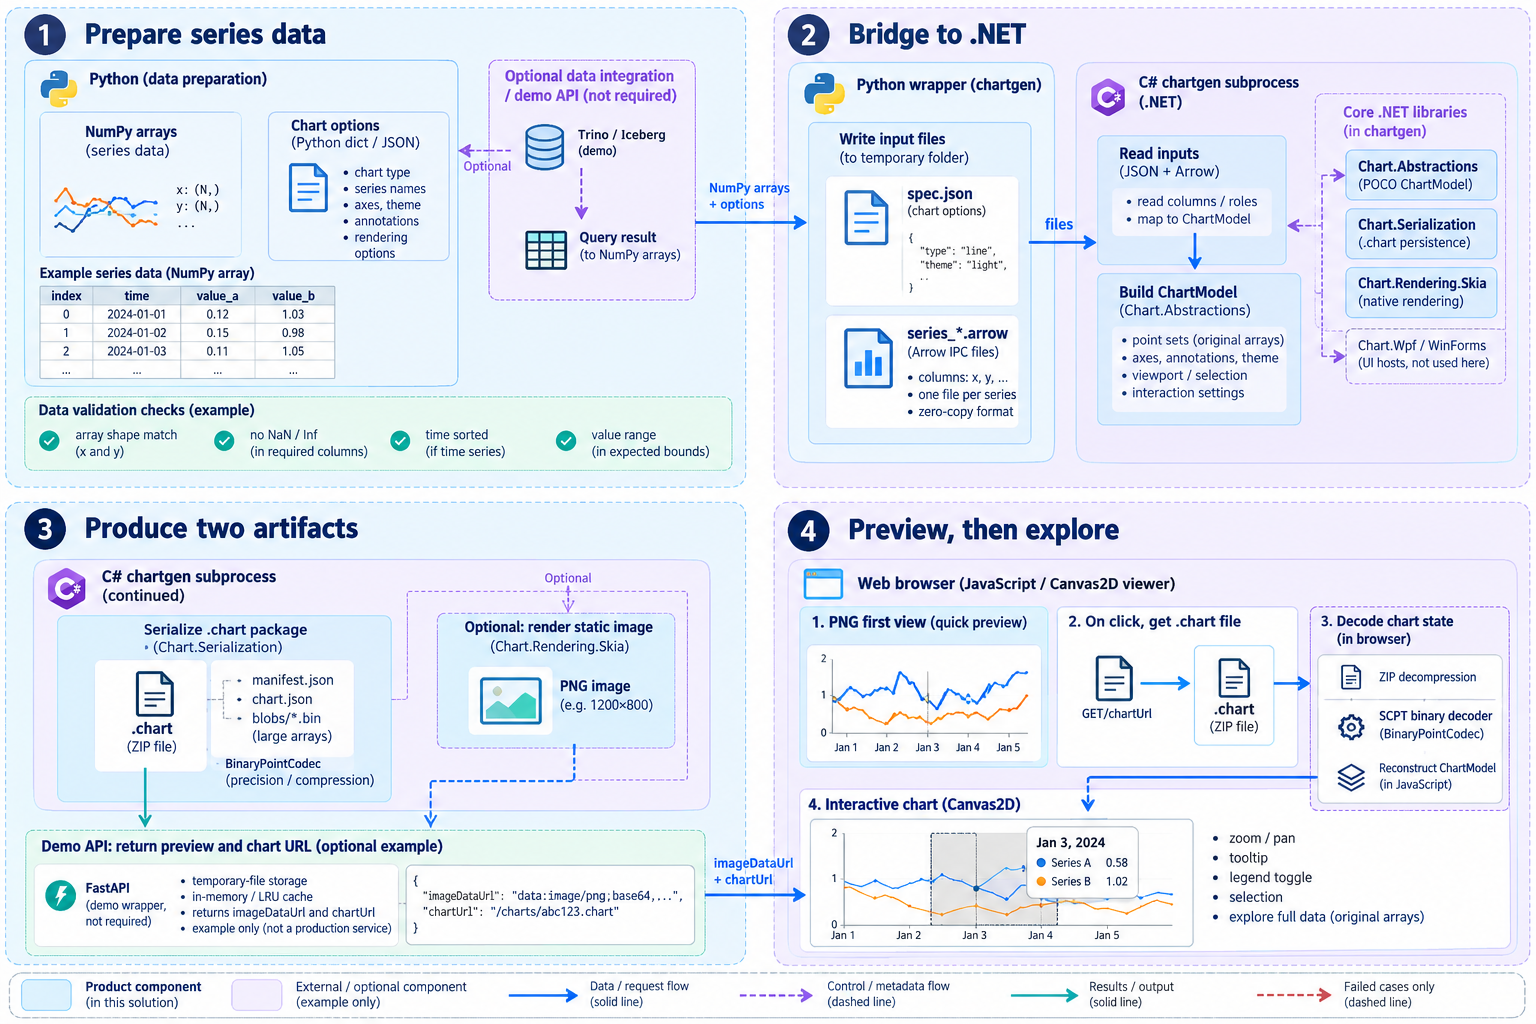
- 1.Prepare series data
- Assemble NumPy arrays and chart options. SQL results can supply data, but the Trino and Iceberg example infrastructure is not required by the chart library.
- 2.Pass data to .NET
- The Python wrapper writes spec.json and per-series Arrow IPC files, then starts chartgen. C# interprets column roles and assembles ChartModel.
- 3.Produce two artifacts
- Save the .chart package and optionally generate a Skia PNG. The FastAPI example returns imageDataUrl and a separate chartUrl for downloading the chart file.
- 4.Preview, then explore
- Show the PNG first and fetch .chart on click. The browser decodes ZIP and SCPT data, then handles zoom, pan and tooltips in Canvas2D.
Python, FastAPI and Trino are optional integrations. The web example’s temporary-file cache is not permanent storage; the browser renders downloaded .chart data with its own Canvas engine.
View GitHub documentation and codeChart features through visual examples
See how markers, axes, annotations and statistical overlays change a native chart.
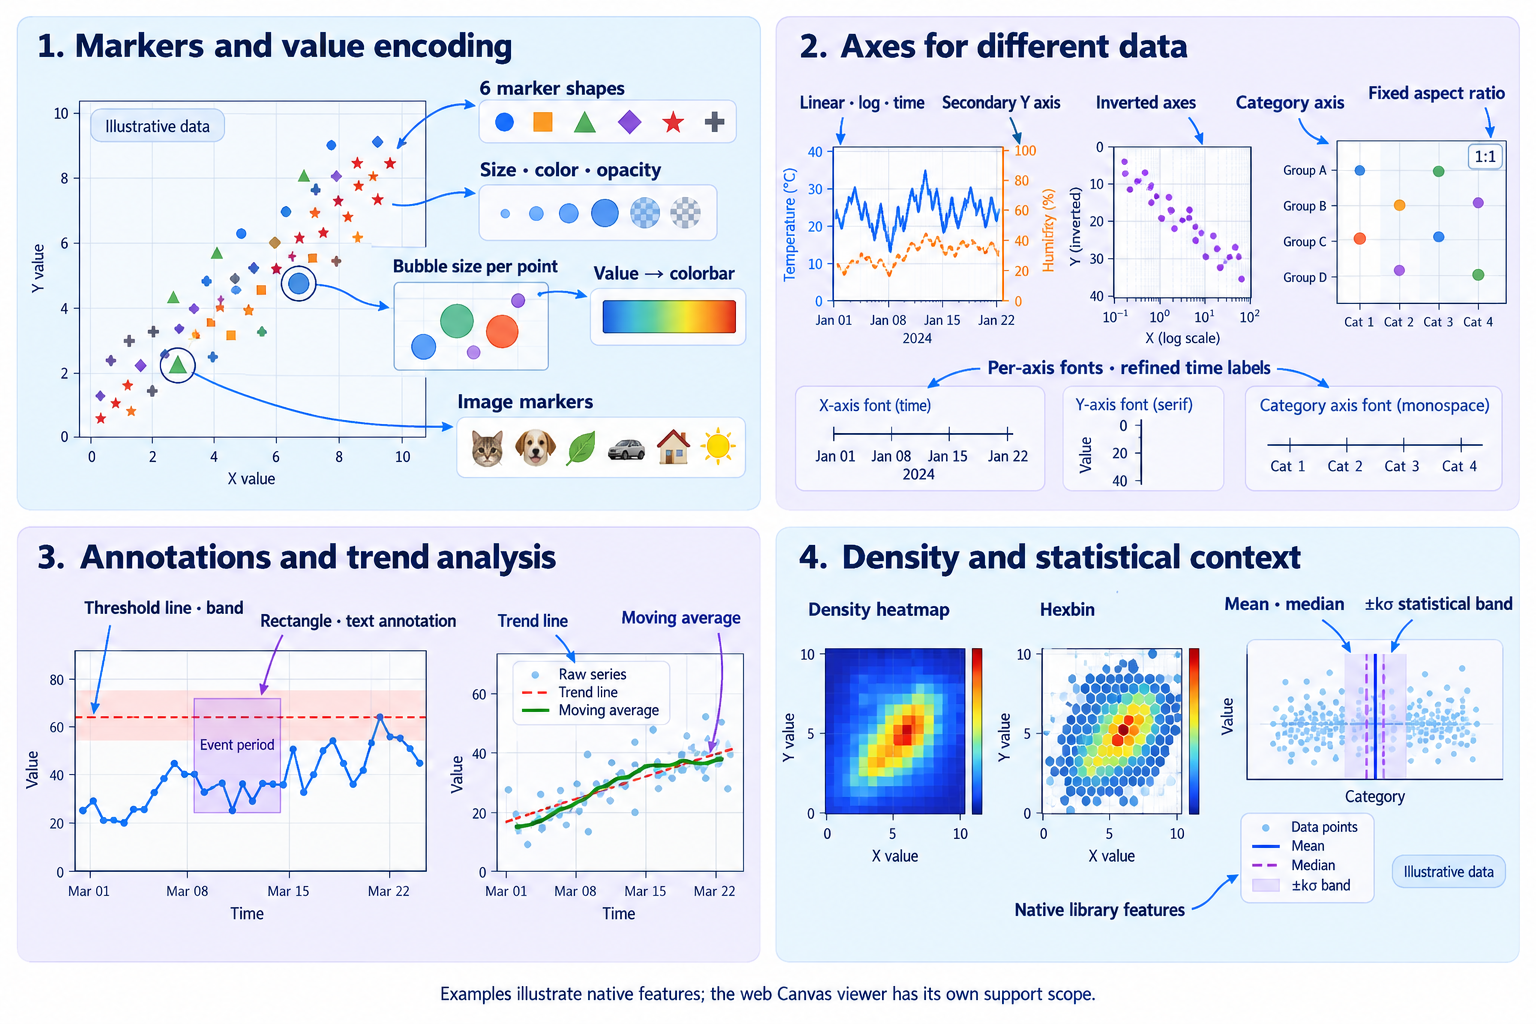
- 1.Markers
- Encode values with shapes, bubbles, colors and images.
- 2.Axes
- Choose scale, time formatting, secondary axes and aspect ratio.
- 3.Annotations
- Add thresholds, regions, text, trend lines and moving averages.
- 4.Statistics
- Inspect density views and mean, median and deviation bands.
Examples illustrate native features; the web Canvas viewer has its own support scope.
View GitHub documentation and codeInteract, save and render large charts
Explore the native interactions and export path, with performance numbers attributed to the repository.
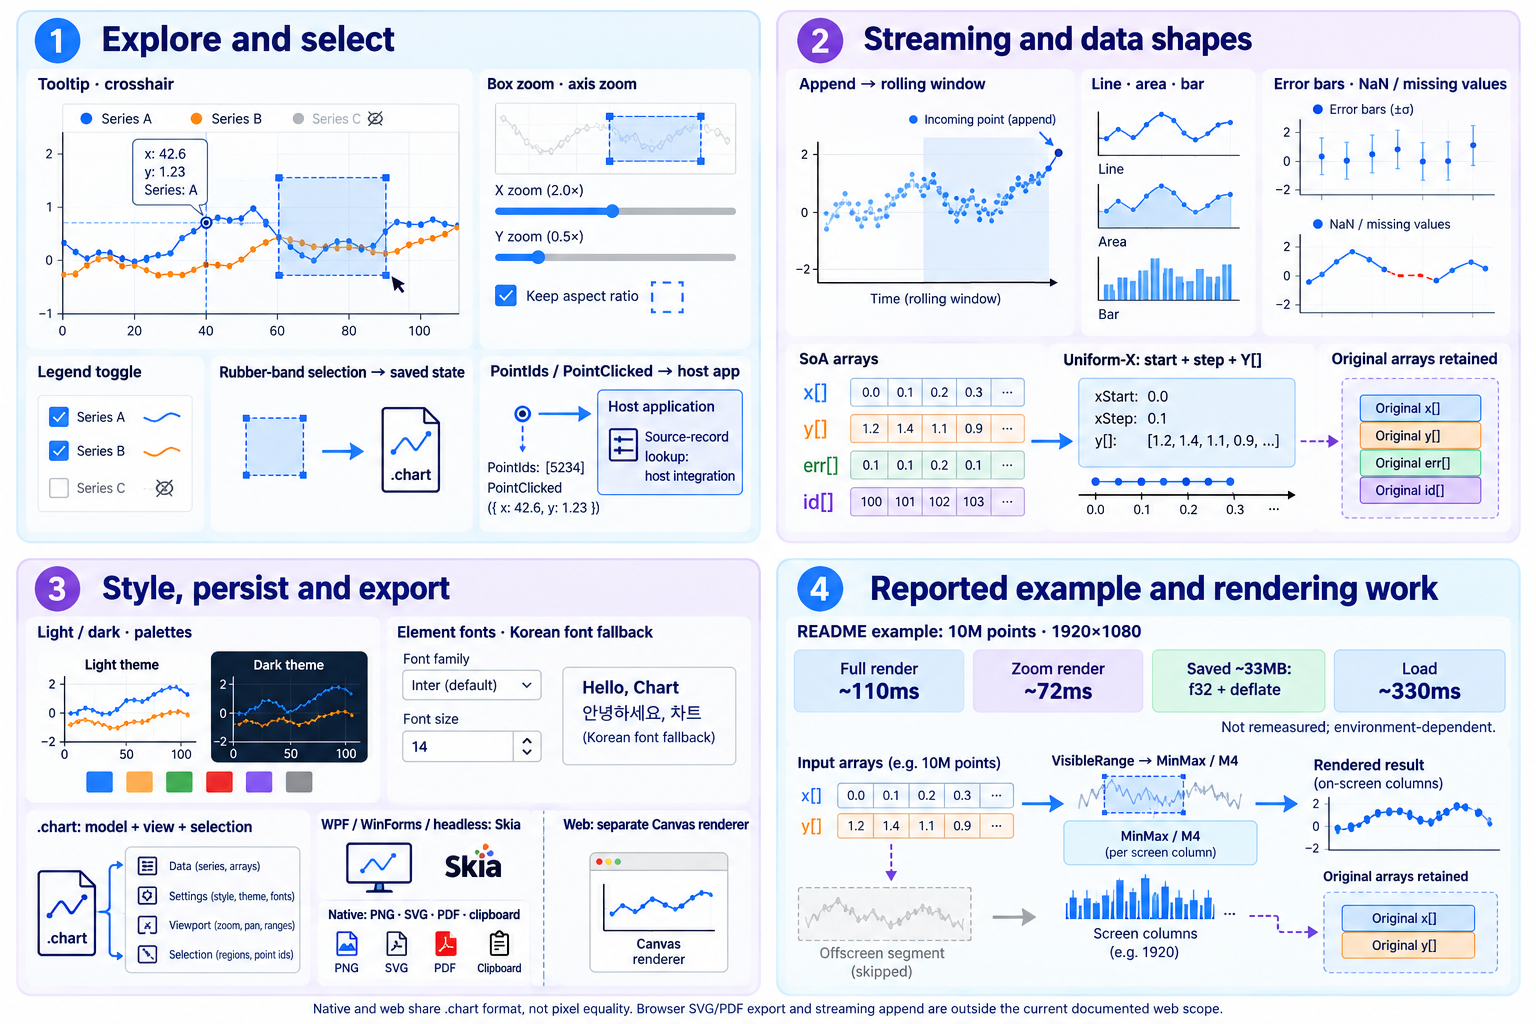
- 1.Interaction
- Zoom, select and forward point identifiers to the host application.
- 2.Data handling
- Append points, vary series styles and preserve missing values.
- 3.Outputs
- Persist chart state and use native image/vector exports.
- 4.Performance context
- Cull and downsample rendering while keeping source arrays.
Native and web share .chart format, not pixel equality. Browser SVG/PDF export and streaming append are outside the current documented web scope.
View GitHub documentation and codeFeature Gallery
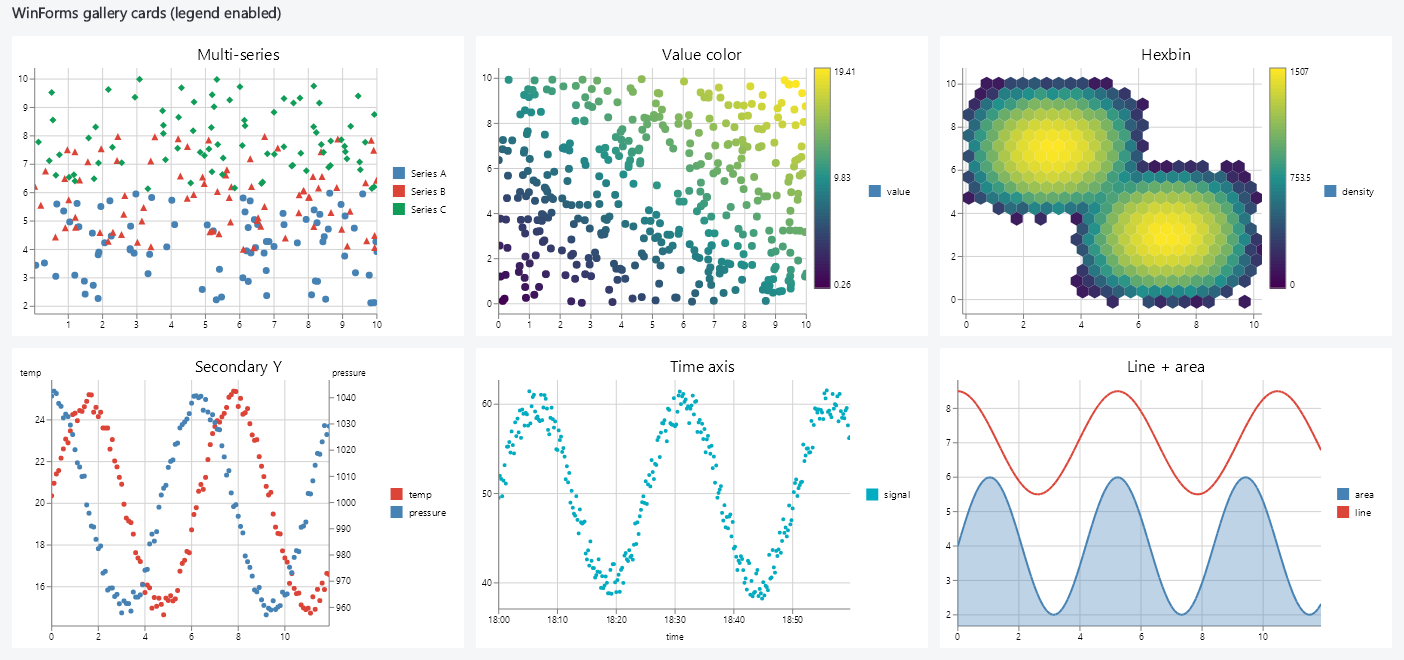
Multi-series · value-to-color mapping · density hexbin · secondary Y axis · time axis · line+area — commercial-grade features from a single renderer.
Advanced Analysis Features
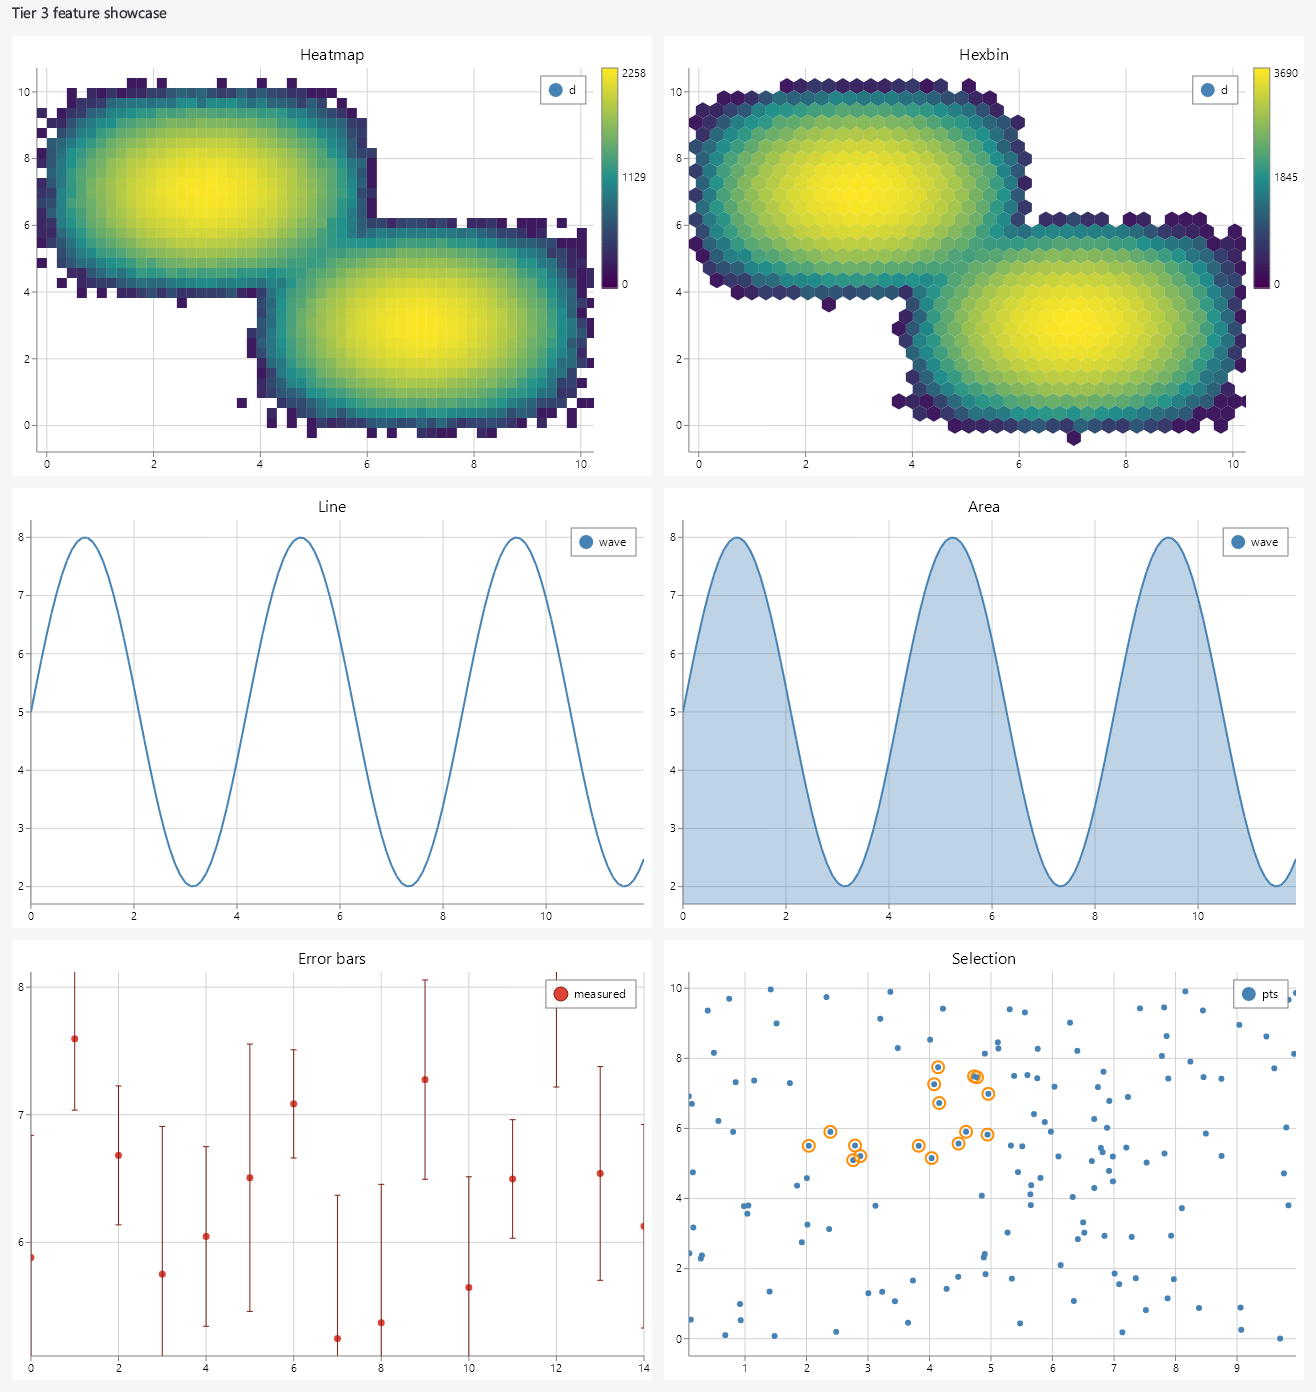
Density heatmap/hexbin · line/area · error bars · rubber-band selection — analysis state is saved and restored too.
Try ScatterSharp
Open source under the Apache License 2.0. Find the source and samples (10M benchmark, WinForms demo, feature showcase) on GitHub.